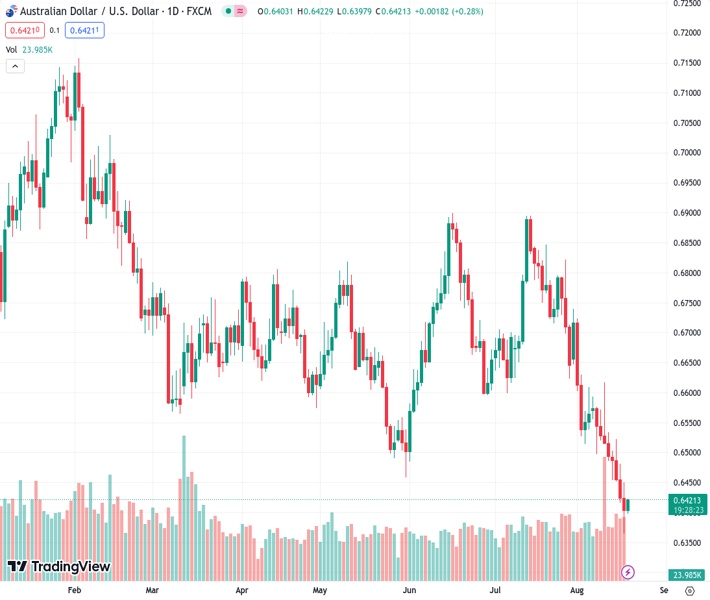
The AUDUSD currency pair, trading at 0.64200, experienced a positive movement on Friday, breaking an eight-day continuous decline to reach the lowest point of the year so far.
…
This is a premium post.
[s2If !current_user_can(access_s2member_level4)]Please register for FREE REGISTER to read full post below containing analysis. In case of any error or you think you are not able to read the full post below, please email us at support#nehcap.com [lwa][/s2If] [s2If current_user_can(access_s2member_level1)]
- AUD/USD gains positive traction on Friday and snaps an eight-day losing streak to the YTD low.
The pair currently trades last at 0.64200.
The previous day high was 0.645 while the previous day low was 0.6364. The daily 38.2% Fib levels comes at 0.6397, expected to provide support. Similarly, the daily 61.8% fib level is at 0.6418, expected to provide support.
The AUD/USD pair builds on the overnight bounce from the 0.6365 area, or its lowest level since November 2022 and gains some positive traction during the Asian session on Friday. Spot prices climb further beyond the 0.6400 mark in the last hour and for now, seem to have snapped an eight-day losing streak, though any meaningful appreciating move still seems elusive.
Fears over China’s debt-laden property sector intensified after Evergrande – the country’s second-large realtor – and a related company – Tianji Holdings – filed for protection from creditors in a US bankruptcy court on Thursday. This adds to concerns about the worsening economic conditions in China and fuels speculations about additional stimulus measures, which, in turn, drives some flows towards the China-proxy Australian Dollar (AUD). The US Dollar (USD), on the other hand, is seen consolidating just below its highest level since July 12 touched on Thursday and turns out to be another factor lending some support to the AUD/USD pair’.
The USD downtick, meanwhile, could be solely attributed to a modest pullback in the US Treasury bond yields from a multi-year peak. It is worth recalling that the yield on the benchmark 10-year US government bond shot back closer to its highest level since 2008 touched in October 2022 in the wake of growing acceptance that the Federal Reserve (Fed) will keep interest rates higher for longer. The expectations were reaffirmed by the July 25-26 FOMC meeting minutes, which revealed that policymakers continued to prioritize the battle against inflation. This should act as a tailwind for the US bond yields and the USD, eventually capping the AUD/USD pair.
Traders might also refrain from placing aggressive bullish bets around the Aussie in the wake of rising bets for another on-hold rate decision by the Reserve Bank of Australia (RBA) in September, bolstered by the disappointing domestic jobs data on Thursday. In fact, the Australian Bureau of Statistics (ABS) reported that the economy lost a net 14,600 jobs and the Unemployment Rate unexpectedly rose to 3.7% in July. Hence, it will be prudent to wait for strong follow-through buying before confirming that the AUD/USD pair has formed a near-term bottom and positioning for any further recovery in the absence of any relevant economic data from the US.
Technical Levels: Supports and Resistances
AUDUSD currently trading at 0.6415 at the time of writing. Pair opened at 0.6404 and is trading with a change of 0.17 % .
| Overview | Overview.1 | |
|---|---|---|
| 0 | Today last price | 0.6415 |
| 1 | Today Daily Change | 0.0011 |
| 2 | Today Daily Change % | 0.1700 |
| 3 | Today daily open | 0.6404 |
The pair remains strongly bearish on the daily time frame. It trades below the 20 SMA @ 0.659, 50 SMA 0.6682, 100 SMA @ 0.6672 and 200 SMA @ 0.6736.
| Trends | Trends.1 | |
|---|---|---|
| 0 | Daily SMA20 | 0.6590 |
| 1 | Daily SMA50 | 0.6682 |
| 2 | Daily SMA100 | 0.6672 |
| 3 | Daily SMA200 | 0.6736 |
The previous day high was 0.645 while the previous day low was 0.6364. The daily 38.2% Fib levels comes at 0.6397, expected to provide support. Similarly, the daily 61.8% fib level is at 0.6418, expected to provide support.
Note the levels of interest below:
- Pivot support is noted at 0.6362, 0.632, 0.6276
- Pivot resistance is noted at 0.6448, 0.6492, 0.6534
| Levels | Levels.1 |
|---|---|
| Previous Daily High | 0.6450 |
| Previous Daily Low | 0.6364 |
| Previous Weekly High | 0.6617 |
| Previous Weekly Low | 0.6486 |
| Previous Monthly High | 0.6895 |
| Previous Monthly Low | 0.6599 |
| Daily Fibonacci 38.2% | 0.6397 |
| Daily Fibonacci 61.8% | 0.6418 |
| Daily Pivot Point S1 | 0.6362 |
| Daily Pivot Point S2 | 0.6320 |
| Daily Pivot Point S3 | 0.6276 |
| Daily Pivot Point R1 | 0.6448 |
| Daily Pivot Point R2 | 0.6492 |
| Daily Pivot Point R3 | 0.6534 |
[/s2If]
Download Nehcap EAWe have two EAs that are operational on our LIVE accounts.
- EA-FIX: Check out the details here. Download EA-FIX . EA-FIX is a non-grid HFT scalper.
- EA-GROWTH: High quality low dd EA using trend grids. Download EA_GROWTHJoin Our Telegram Group
")


