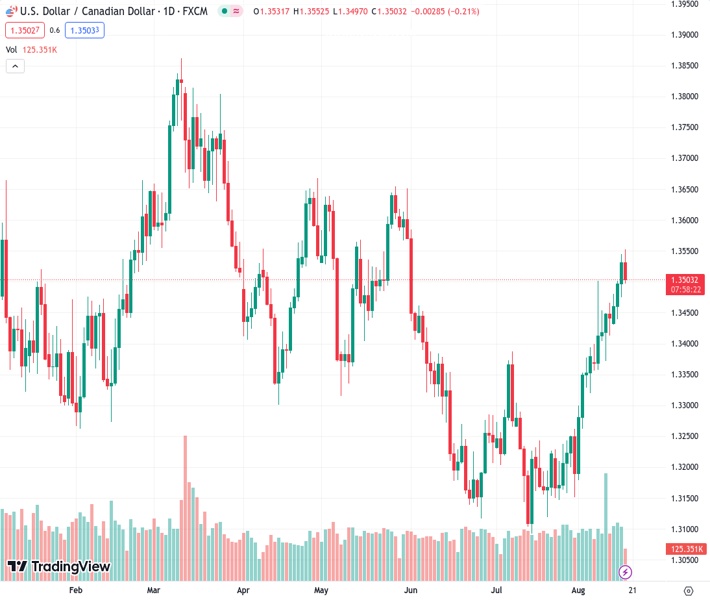
The USDCAD pair, which is currently at 1.35033, is expected to move closer to 1.3500 as it mirrors the movements of the US Dollar.
…
This is a premium post.
[s2If !current_user_can(access_s2member_level4)]Please register for FREE REGISTER to read full post below containing analysis. In case of any error or you think you are not able to read the full post below, please email us at support#nehcap.com [lwa][/s2If] [s2If current_user_can(access_s2member_level1)]
- USD/CAD corrects to near 1.3500, following the footprints of the US Dollar.
The pair currently trades last at 1.35033.
The previous day high was 1.3545 while the previous day low was 1.3475. The daily 38.2% Fib levels comes at 1.3519, expected to provide resistance. Similarly, the daily 61.8% fib level is at 1.3502, expected to provide support.
The USD/CAD pair finds selling pressure to near 1.3552 after a three-day winning spell and corrects to near the psychological support of 1.3500. The Loonie asset faces pressure amid a correction in the US Dollar Index (DXY) as the risk-aversion theme starts fading.
S&P500 futures generate some gains in the European session as investors seem confident that the Federal Reserve (Fed) will not raise interest rates further despite resilience in the United States economy. As per the CME FedWatch Tool, more than 88% of chances are in favor of a steady interest rate decision for the September policy.
The USD Index extends correction to near 103.20 as the US Department of Labor reported a decline in individuals claiming jobless benefits for the first time to 239K vs. expectations of 240K and the former release of 250K for the week ending August 11.
USD/CAD trades in a Rising Channel chart pattern on an hourly scale in which each pullback is considered as buying opportunities by the market participants. The Loonie asset has corrected to near the immediate support plotted from August 8 high around 1.3500. Also, the upward-sloping 50-period Exponential Moving Average (EMA) at 1.3505 is providing support to the US Dollar bulls.
The Relative Strength Index (RSI) (14) seems edgy around 40.00. A breakdown below the same will activate the bearish impulse.
Going forward, a decisive break above the intraday high at 1.3552 will drive the major toward June high at 1.3585, followed by May high at 1.3650.
In an alternate scenario, a downside move below July 18 high at 1.3288 would drag the asset toward July 27 low around 1.3160 and July 14 low marginally below 1.3100.
Technical Levels: Supports and Resistances
USDCAD currently trading at 1.3507 at the time of writing. Pair opened at 1.3533 and is trading with a change of -0.19 % .
| Overview | Overview.1 | |
|---|---|---|
| 0 | Today last price | 1.3507 |
| 1 | Today Daily Change | -0.0026 |
| 2 | Today Daily Change % | -0.1900 |
| 3 | Today daily open | 1.3533 |
The pair remains strongly bullish on the daily timeframe. It trades above its 20 SMA @ 1.3328, 50 SMA 1.3274, 100 SMA @ 1.3384 and 200 SMA @ 1.3451.
| Trends | Trends.1 | |
|---|---|---|
| 0 | Daily SMA20 | 1.3328 |
| 1 | Daily SMA50 | 1.3274 |
| 2 | Daily SMA100 | 1.3384 |
| 3 | Daily SMA200 | 1.3451 |
The previous day high was 1.3545 while the previous day low was 1.3475. The daily 38.2% Fib levels comes at 1.3519, expected to provide resistance. Similarly, the daily 61.8% fib level is at 1.3502, expected to provide support.
Note the levels of interest below:
- Pivot support is noted at 1.349, 1.3448, 1.342
- Pivot resistance is noted at 1.356, 1.3588, 1.363
| Levels | Levels.1 |
|---|---|
| Previous Daily High | 1.3545 |
| Previous Daily Low | 1.3475 |
| Previous Weekly High | 1.3502 |
| Previous Weekly Low | 1.3356 |
| Previous Monthly High | 1.3387 |
| Previous Monthly Low | 1.3093 |
| Daily Fibonacci 38.2% | 1.3519 |
| Daily Fibonacci 61.8% | 1.3502 |
| Daily Pivot Point S1 | 1.3490 |
| Daily Pivot Point S2 | 1.3448 |
| Daily Pivot Point S3 | 1.3420 |
| Daily Pivot Point R1 | 1.3560 |
| Daily Pivot Point R2 | 1.3588 |
| Daily Pivot Point R3 | 1.3630 |
[/s2If]
Download Nehcap EAWe have two EAs that are operational on our LIVE accounts.
- EA-FIX: Check out the details here. Download EA-FIX . EA-FIX is a non-grid HFT scalper.
- EA-GROWTH: High quality low dd EA using trend grids. Download EA_GROWTHJoin Our Telegram Group
")


