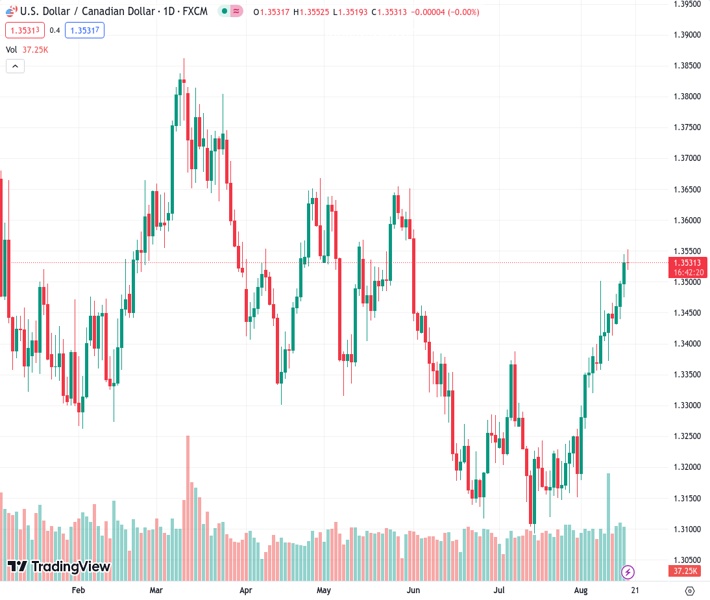
The US dollar against the Canadian dollar is currently trading at around 1.3530, slightly higher than the previous rate of 1.35323, due to strong US economic data. The market is closely watching the US Initial Jobless Claims for further direction.
…
This is a premium post.
[s2If !current_user_can(access_s2member_level4)]Please register for FREE REGISTER to read full post below containing analysis. In case of any error or you think you are not able to read the full post below, please email us at support#nehcap.com [lwa][/s2If] [s2If current_user_can(access_s2member_level1)]
- The pair currently trades last at 1.35323.
- Pivot support is noted at 1.349, 1.3448, 1.342
- Pivot resistance is noted at 1.356, 1.3588, 1.363
- EA-FIX: Check out the details here. Download EA-FIX . EA-FIX is a non-grid HFT scalper.
- EA-GROWTH: High quality low dd EA using trend grids. Download EA_GROWTHJoin Our Telegram Group
The previous day high was 1.3545 while the previous day low was 1.3475. The daily 38.2% Fib levels comes at 1.3519, expected to provide support. Similarly, the daily 61.8% fib level is at 1.3502, expected to provide support.
Technical Levels: Supports and Resistances
USDCAD currently trading at 1.3534 at the time of writing. Pair opened at 1.3533 and is trading with a change of 0.01 % .
| Overview | Overview.1 | |
|---|---|---|
| 0 | Today last price | 1.3534 |
| 1 | Today Daily Change | 0.0001 |
| 2 | Today Daily Change % | 0.0100 |
| 3 | Today daily open | 1.3533 |
The pair remains strongly bullish on the daily timeframe. It trades above its 20 SMA @ 1.3328, 50 SMA 1.3274, 100 SMA @ 1.3384 and 200 SMA @ 1.3451.
| Trends | Trends.1 | |
|---|---|---|
| 0 | Daily SMA20 | 1.3328 |
| 1 | Daily SMA50 | 1.3274 |
| 2 | Daily SMA100 | 1.3384 |
| 3 | Daily SMA200 | 1.3451 |
The previous day high was 1.3545 while the previous day low was 1.3475. The daily 38.2% Fib levels comes at 1.3519, expected to provide support. Similarly, the daily 61.8% fib level is at 1.3502, expected to provide support.
Note the levels of interest below:
| Levels | Levels.1 |
|---|---|
| Previous Daily High | 1.3545 |
| Previous Daily Low | 1.3475 |
| Previous Weekly High | 1.3502 |
| Previous Weekly Low | 1.3356 |
| Previous Monthly High | 1.3387 |
| Previous Monthly Low | 1.3093 |
| Daily Fibonacci 38.2% | 1.3519 |
| Daily Fibonacci 61.8% | 1.3502 |
| Daily Pivot Point S1 | 1.3490 |
| Daily Pivot Point S2 | 1.3448 |
| Daily Pivot Point S3 | 1.3420 |
| Daily Pivot Point R1 | 1.3560 |
| Daily Pivot Point R2 | 1.3588 |
| Daily Pivot Point R3 | 1.3630 |
[/s2If]
Download Nehcap EAWe have two EAs that are operational on our LIVE accounts.
")


