The NZDUSD pair is facing difficulties in gaining momentum as a result of the strength of the US dollar and the economic troubles faced by China.
…
This is a premium post.
[s2If !current_user_can(access_s2member_level4)]Please register for FREE REGISTER to read full post below containing analysis. In case of any error or you think you are not able to read the full post below, please email us at support#nehcap.com [lwa][/s2If] [s2If current_user_can(access_s2member_level1)]
- NZD/USD struggles to gain amid the US dollar strength, China’s economic woes.
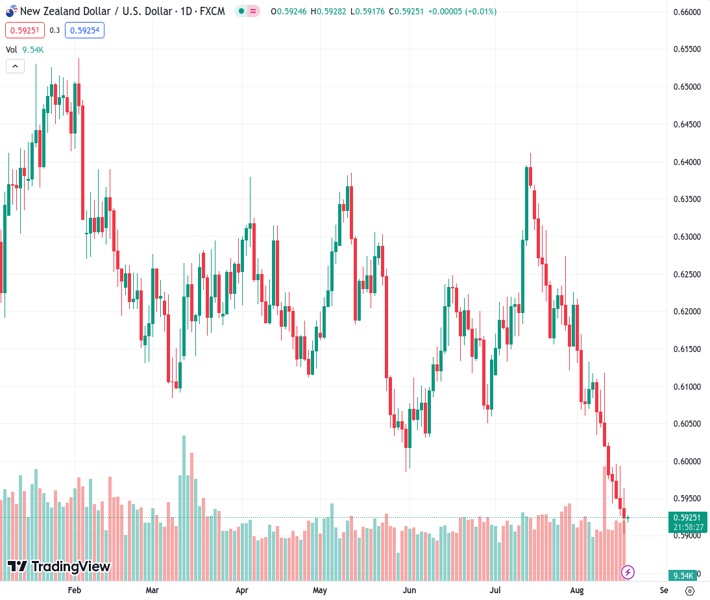
The pair currently trades last at 0.59230.
The previous day high was 0.5994 while the previous day low was 0.5926. The daily 38.2% Fib levels comes at 0.5952, expected to provide resistance. Similarly, the daily 61.8% fib level is at 0.5968, expected to provide resistance.
The NZD/USD pair remains on the defensive above the 0.5900 mark in the early Asian session. The pair trades in negative territory for the eighth consecutive day on Friday amid the stronger US Dollar and higher US yields. NZD/USD currently trades near 0.5926, losing 0.03% on the day.
The US Bureau of Labour Statistics (BLS) showed on Thursday that the number of jobless claims increased to 239K for the week ending on August 12. The figure came in slightly below the market expectation of 240K and suggests that the US labor market is robust. The Continuing Jobless Claims increased to 1.716 million, the highest level seen in the last four weeks. Lastly, the Philadelphia Federal Reserve’s Manufacturing Survey for August improved to 12, above the expectation of -10 and the previous month of -12.
The upbeat data opens the door for additional rate hikes by the Federal Reserve (Fed) and boosts the US dollar across the board. The Federal Open Market Committee (FOMC) Minutes emphasized that inflation remained unacceptably high. The Fed official saw significant inflationary risks, and it may need additional tightening of monetary policy to bring inflation to the longer-run target. Federal Reserve officials endorsed that future rate decisions would be based on the incoming data, but they would be more cautious in the coming months.
On the other hand, the Reserve Bank of New Zealand (RBNZ) kept the benchmark interest rates unchanged at 5.5%, as expected on Wednesday. RBNZ Governor Adrian Orr also offered a hawkish signal to rein in rising inflation expectations. Orr stated that the drivers of inflation have changed over time, but they have all been skewed towards higher inflation than otherwise.
Furthermore, Evergrande, China’s second-largest real estate company filed for bankruptcy in a US court on Thursday, according to Reuters. This report fuels the fear of a potential Chinese property catastrophe. On Thursday, Fitch Ratings might reconsider China’s A+ sovereign credit rating in the face of intensifying economic headwinds. This, in turn, might cap the upside of the China-proxy Kiwi and acts as a headwind for NZD/USD.
In the absence of the top-tier economic data release from both New Zealand and the US, market participants will digest the data from this week. However, the headlines surrounding China’s economic woes remain in focus.
Technical Levels: Supports and Resistances
NZDUSD currently trading at 0.5925 at the time of writing. Pair opened at 0.5937 and is trading with a change of -0.2 % .
| Overview | Overview.1 | |
|---|---|---|
| 0 | Today last price | 0.5925 |
| 1 | Today Daily Change | -0.0012 |
| 2 | Today Daily Change % | -0.2000 |
| 3 | Today daily open | 0.5937 |
The pair remains strongly bearish on the daily time frame. It trades below the 20 SMA @ 0.6103, 50 SMA 0.6158, 100 SMA @ 0.6176 and 200 SMA @ 0.6234.
| Trends | Trends.1 | |
|---|---|---|
| 0 | Daily SMA20 | 0.6103 |
| 1 | Daily SMA50 | 0.6158 |
| 2 | Daily SMA100 | 0.6176 |
| 3 | Daily SMA200 | 0.6234 |
The previous day high was 0.5994 while the previous day low was 0.5926. The daily 38.2% Fib levels comes at 0.5952, expected to provide resistance. Similarly, the daily 61.8% fib level is at 0.5968, expected to provide resistance.
Note the levels of interest below:
- Pivot support is noted at 0.5911, 0.5884, 0.5843
- Pivot resistance is noted at 0.5979, 0.602, 0.6047
| Levels | Levels.1 |
|---|---|
| Previous Daily High | 0.5994 |
| Previous Daily Low | 0.5926 |
| Previous Weekly High | 0.6118 |
| Previous Weekly Low | 0.5974 |
| Previous Monthly High | 0.6413 |
| Previous Monthly Low | 0.6120 |
| Daily Fibonacci 38.2% | 0.5952 |
| Daily Fibonacci 61.8% | 0.5968 |
| Daily Pivot Point S1 | 0.5911 |
| Daily Pivot Point S2 | 0.5884 |
| Daily Pivot Point S3 | 0.5843 |
| Daily Pivot Point R1 | 0.5979 |
| Daily Pivot Point R2 | 0.6020 |
| Daily Pivot Point R3 | 0.6047 |
[/s2If]
Download Nehcap EAWe have two EAs that are operational on our LIVE accounts.
- EA-FIX: Check out the details here. Download EA-FIX . EA-FIX is a non-grid HFT scalper.
- EA-GROWTH: High quality low dd EA using trend grids. Download EA_GROWTHJoin Our Telegram Group
")


