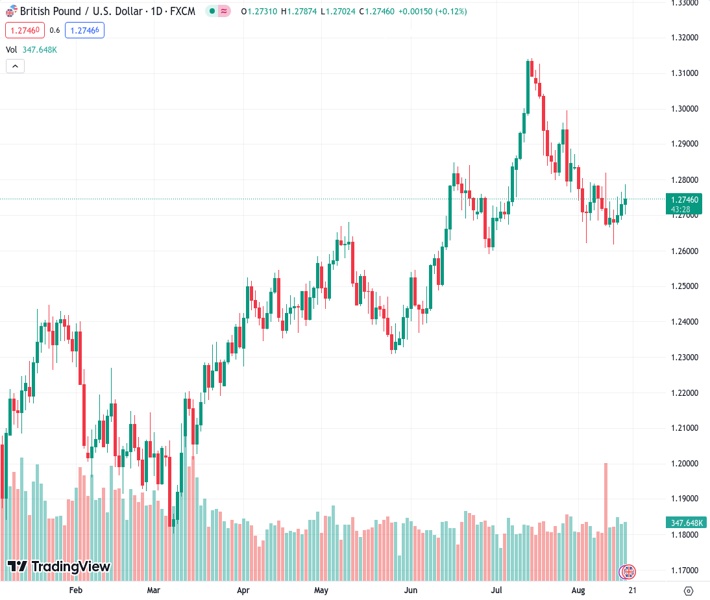
The GBPUSD pair has experienced a three-day period of upward movement, increasing by 0.14% and currently trading at 1.2740. The pair’s trading range has been between 1.2702 and 1.2787.
…
This is a premium post.
[s2If !current_user_can(access_s2member_level4)]Please register for FREE REGISTER to read full post below containing analysis. In case of any error or you think you are not able to read the full post below, please email us at support#nehcap.com [lwa][/s2If] [s2If current_user_can(access_s2member_level1)]
- GBP/USD marks a three-day uptrend, gaining 0.14%, trading at 1.2740 within a range of 1.2702/1.2787.
The pair currently trades last at 1.27466.
The previous day high was 1.2766 while the previous day low was 1.2687. The daily 38.2% Fib levels comes at 1.2736, expected to provide support. Similarly, the daily 61.8% fib level is at 1.2717, expected to provide support.
The Pound Sterling (GBP) prolongs its uptrend to three straight days, as seen by the GBP/USD gaining 0.14%, despite market sentiment shifting sour due to global bond yields edging higher. Expectations that central banks would keep borrowing costs higher for longer are taking their toll on equities. The GBP/USD exchanges hands at 1.2740 after seesawing within a low and high of 1.2702/1.2787.
Current week data has bolstered the GBP/USD pair, though it remains capped by high US Treasury bond yields. Even though the UK’s Unemployment Rate edged above the 4% forecast at 4.2%, the wage jump increased the chances of a Bank of England (BoE) rate hike. Wednesday’s data further reinforced that, as UK inflation decelerated as expected to 6.8% YoY, core inflation exceeded forecasts of 6.8%, rising to 6.9%. Consequently, the GBP/USD advanced.
Across the pond, the US Bureau of Labor Statistics (BLS) reported that last week’s unemployment claims rose to 239K, below estimates of 240K, still portraying a robust labor market. At the same time, the Philadelphia Fed revealed its Manufacturing Index for August came at 12, improving above the -10 contraction expected by analysts.
On Wednesday, the Fed released its July meeting minutes which showed Fed members still see upside risks on inflation, suggesting that further tightening would be needed. However, they would take into account upcoming data for the following meetings. Of note, Fed officials have expressed the need to stop hiking rates, led by some regional Fed Presidents, like Bostic, Goolsbee, Harker, and Barkin.
Following Wednesday’s data release, the Atlanta Fed GDPNow model portrays the US Q3 2023 GDP at around 5.8%, up from 4.1% on August 8. Given those developments, the swaps market has shown increased chances for a Federal Reserve 25 bps rate hike at the upcoming November meeting.
Sterling is trading slightly higher near $1.2750 but remains on track to test the late June low near $1.2590
The US economic docket is empty, while the UK would reveal the Gfk Consumer Confidence alongside Retail Sales for July.
The GBP/USD daily chart portrays the pair bottomed around 1.2620 and remains tilted to the upside but capped by technical indicators. As of writing, the GBP/USD pair remained below a downslope resistance trendline and tested the 50-day Moving Average (DMA) at 1.2782, two levels aggressively defended by sellers. If GBP/USD fails to conquer 1.2800, the path of least resistance could push the price towards the low of the week at 1.2620. Otherwise, if GBP/USD reclaims the 50-DMA, the 1.2800 would be up for grabs.
Technical Levels: Supports and Resistances
GBPUSD currently trading at 1.2746 at the time of writing. Pair opened at 1.2732 and is trading with a change of 0.11 % .
| Overview | Overview.1 | |
|---|---|---|
| 0 | Today last price | 1.2746 |
| 1 | Today Daily Change | 0.0014 |
| 2 | Today Daily Change % | 0.1100 |
| 3 | Today daily open | 1.2732 |
The pair is trading below its 20 Daily moving average @ 1.2778, below its 50 Daily moving average @ 1.2781 , above its 100 Daily moving average @ 1.2621 and above its 200 Daily moving average @ 1.2369
| Trends | Trends.1 | |
|---|---|---|
| 0 | Daily SMA20 | 1.2778 |
| 1 | Daily SMA50 | 1.2781 |
| 2 | Daily SMA100 | 1.2621 |
| 3 | Daily SMA200 | 1.2369 |
The previous day high was 1.2766 while the previous day low was 1.2687. The daily 38.2% Fib levels comes at 1.2736, expected to provide support. Similarly, the daily 61.8% fib level is at 1.2717, expected to provide support.
Note the levels of interest below:
- Pivot support is noted at 1.269, 1.2649, 1.2611
- Pivot resistance is noted at 1.277, 1.2808, 1.2849
| Levels | Levels.1 |
|---|---|
| Previous Daily High | 1.2766 |
| Previous Daily Low | 1.2687 |
| Previous Weekly High | 1.2819 |
| Previous Weekly Low | 1.2666 |
| Previous Monthly High | 1.3142 |
| Previous Monthly Low | 1.2659 |
| Daily Fibonacci 38.2% | 1.2736 |
| Daily Fibonacci 61.8% | 1.2717 |
| Daily Pivot Point S1 | 1.2690 |
| Daily Pivot Point S2 | 1.2649 |
| Daily Pivot Point S3 | 1.2611 |
| Daily Pivot Point R1 | 1.2770 |
| Daily Pivot Point R2 | 1.2808 |
| Daily Pivot Point R3 | 1.2849 |
[/s2If]
Download Nehcap EAWe have two EAs that are operational on our LIVE accounts.
- EA-FIX: Check out the details here. Download EA-FIX . EA-FIX is a non-grid HFT scalper.
- EA-GROWTH: High quality low dd EA using trend grids. Download EA_GROWTHJoin Our Telegram Group
")


