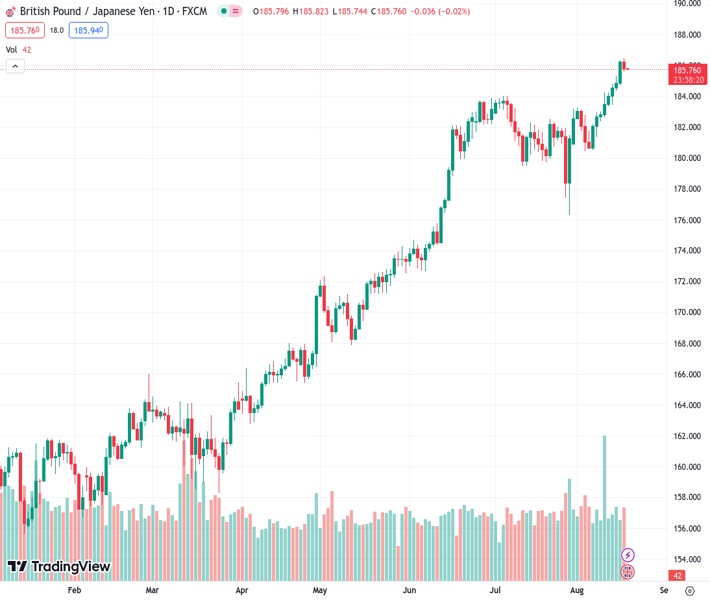
The GBPJPY pair remains at its highest levels in a repetitive pattern close to the 186.30 region.
…
This is a premium post.
[s2If !current_user_can(access_s2member_level4)]Please register for FREE REGISTER to read full post below containing analysis. In case of any error or you think you are not able to read the full post below, please email us at support#nehcap.com [lwa][/s2If] [s2If current_user_can(access_s2member_level1)]
- GBP/JPY continues to trade in cycle highs near the 186.30 area.
The pair currently trades last at 185.754.
The previous day high was 186.35 while the previous day low was 184.7. The daily 38.2% Fib levels comes at 185.72, expected to provide support. Similarly, the daily 61.8% fib level is at 185.33, expected to provide support.
On Thursday, the GBP/JPY fell below 186.00 as investors seemed to be taking profits after eight straight days of gains. On the one hand, the Pound gains interest in hawkish bets on the Bank of England (BoE), while the Bank of Japan’s (BoJ) extremely dovish stance continues to pressure the JPY. Eyes on Japanese inflation figures from July to be reported on Friday.
The GBP continues to trade strong against its rivals, mainly driven by rising wages in the UK and hot inflation figures from July reported in Wednesday’s session. In that sense, the Pound gained interest on the back of hawkish bets on the Bank of England (BoE) as investors are now betting on a terminal rate of 6% which would mean an additional 75 bps of tightening vs last week where markets expected a terminal rate of 5.75%.
On the other hand, Japan reported soft data. Imports dropped in July by 13.5% and reported a higher than expected Trade Balance Deficit in the same month. In addition, Machinery Orders declined by 5.8% YoY in June, higher than expected. In that sense, as economic activity continues to weaken, the Bank of Japan (BoJ) won’t have any rush to pivot its monetary policy, which will leave the JPY vulnerable against its rivals.
The daily chart analysis indicates a bullish outlook for the GBP/JPY in the short term. The Relative Strength Index (RSI) is above its midline in positive territory, with a positive slope, aligning with the positive signal from the Moving Average Convergence Divergence (MACD), which displays green bars, reinforcing the strong bullish sentiment. Additionally, the pair is above the 20,100,200-day SMAs, suggesting that the bears struggle to challenge the bullish trend.
Plus, bullish signals on the four-hour chart indicate a strong buying momentum, establishing a marked bull dominance over sellers.
Support levels: 185.50, 185.00, 184.00.
Resistance levels: 187.00, 187.50, 188.00.
Technical Levels: Supports and Resistances
GBPJPY currently trading at 185.87 at the time of writing. Pair opened at 186.33 and is trading with a change of -0.25 % .
| Overview | Overview.1 | |
|---|---|---|
| 0 | Today last price | 185.87 |
| 1 | Today Daily Change | -0.46 |
| 2 | Today Daily Change % | -0.25 |
| 3 | Today daily open | 186.33 |
The pair remains strongly bullish on the daily timeframe. It trades above its 20 SMA @ 182.41, 50 SMA 181.55, 100 SMA @ 175.37 and 200 SMA @ 168.87.
| Trends | Trends.1 | |
|---|---|---|
| 0 | Daily SMA20 | 182.41 |
| 1 | Daily SMA50 | 181.55 |
| 2 | Daily SMA100 | 175.37 |
| 3 | Daily SMA200 | 168.87 |
The previous day high was 186.35 while the previous day low was 184.7. The daily 38.2% Fib levels comes at 185.72, expected to provide support. Similarly, the daily 61.8% fib level is at 185.33, expected to provide support.
Note the levels of interest below:
- Pivot support is noted at 185.24, 184.14, 183.58
- Pivot resistance is noted at 186.89, 187.45, 188.54
| Levels | Levels.1 |
|---|---|
| Previous Daily High | 186.35 |
| Previous Daily Low | 184.70 |
| Previous Weekly High | 184.25 |
| Previous Weekly Low | 180.58 |
| Previous Monthly High | 184.02 |
| Previous Monthly Low | 176.32 |
| Daily Fibonacci 38.2% | 185.72 |
| Daily Fibonacci 61.8% | 185.33 |
| Daily Pivot Point S1 | 185.24 |
| Daily Pivot Point S2 | 184.14 |
| Daily Pivot Point S3 | 183.58 |
| Daily Pivot Point R1 | 186.89 |
| Daily Pivot Point R2 | 187.45 |
| Daily Pivot Point R3 | 188.54 |
[/s2If]
Download Nehcap EAWe have two EAs that are operational on our LIVE accounts.
- EA-FIX: Check out the details here. Download EA-FIX . EA-FIX is a non-grid HFT scalper.
- EA-GROWTH: High quality low dd EA using trend grids. Download EA_GROWTHJoin Our Telegram Group
")


