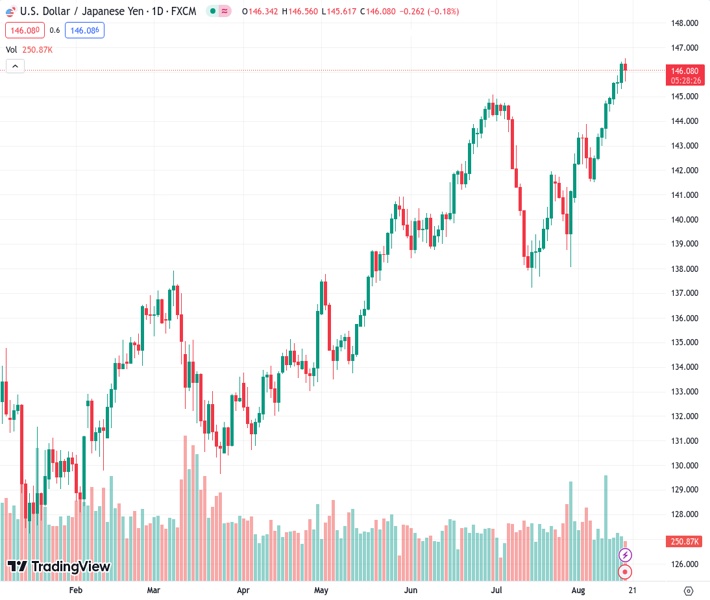
The exchange rate of the USDJPY currency pair reaches its highest level of the year at 145.56, but then drops slightly to 146.12, representing a decrease of 0.15%.
…
This is a premium post.
[s2If !current_user_can(access_s2member_level4)]Please register for FREE REGISTER to read full post below containing analysis. In case of any error or you think you are not able to read the full post below, please email us at support#nehcap.com [lwa][/s2If] [s2If current_user_can(access_s2member_level1)]
- USD/JPY hits YTD highs of 145.56 but trades softer at 146.12, marking a 0.15% decline.
The pair currently trades last at 146.059.
The previous day high was 146.41 while the previous day low was 145.31. The daily 38.2% Fib levels comes at 145.99, expected to provide support. Similarly, the daily 61.8% fib level is at 145.73, expected to provide support.
USD/JPY trades with a softer tone after hitting year-to-date (YTD) highs of 145.56 amid UST bond yields climbing as investors speculate further tightening by the US Federal Reserve (Fed) lies ahead. Global bond yields advanced, but the greenback failed to gain traction. The USD/JPY is trading at 146.12, with losses of 0.15%.
The Japanese Yen (JPY) is recovering ground amid risk-aversion, spurred by investors expecting the Fed could skip from hiking rates in September. Still, chances for additional tightening in November increased compared to a week ago, as shown by the CME FedWatch Tool, with odds at 34.6%, above last week’s 27.8%.
The latest Fed minutes showed the board members unanimously raised rates, despite voices becoming more neutral and worried about pushing rates too far, even though most policymakers still see upside inflation risks. Yet officials are taking a cautious approach to setting monetary policy, as they emphasized they would consider the “totality” of data to “help clarify the extent to which the disinflation process was continuing.”
Another reason that boosted the JPY is the ongoing economic deceleration in China. Recent data from the second-largest economy showed that consumption is slowing down, its exports are taking a hit, and trouble In the property market spurred outflows from Chinese equities. Additionally, China’s shadow bank’s $3 trillion turmoil continues to weigh on its economy.
Aside from this, the US Department of Labor (DoL) revealed the last week’s Initial Jobless Claims, which came at 239K below estimates of 240K. At the same, the Philadelphia Fed Manufacturing Index for August improved, with numbers hitting 12, exceeding the -10 contraction expected by analysts.
The Japanese docket showed that exports fell for the first time since 2021, sparking economic worries. Exports fell -0.3% in July YoY, above s forecast for a -0.8% plunge, but trailed June’s 1.5% rise. USD/JPY focus shifts towards releasing inflation data, with the Consumer Price Index (CPI) for July expected at 2.5% and core CPI at 3.1%.
After reaching YTD highs, the USD/JPY retraced somewhat, towards the 146.00 mark, but remained above the latter, keeping buyers hopeful of higher prices. If USD/JPY achieves a daily close below 146.00, that will trigger a correction, with the June 30 inflection high turned support at 145.07, ahead of the figure. Up next, the Tenkan-Sen emerges as the next support at 144.03. Conversely, if USD/JPY stays bullish, the 147.00 mark would be next, followed by the November 3 daily high at 148.45.
Technical Levels: Supports and Resistances
USDJPY currently trading at 145.96 at the time of writing. Pair opened at 146.34 and is trading with a change of -0.26 % .
| Overview | Overview.1 | |
|---|---|---|
| 0 | Today last price | 145.96 |
| 1 | Today Daily Change | -0.38 |
| 2 | Today Daily Change % | -0.26 |
| 3 | Today daily open | 146.34 |
The pair remains strongly bullish on the daily timeframe. It trades above its 20 SMA @ 142.76, 50 SMA 142.06, 100 SMA @ 138.93 and 200 SMA @ 136.47.
| Trends | Trends.1 | |
|---|---|---|
| 0 | Daily SMA20 | 142.76 |
| 1 | Daily SMA50 | 142.06 |
| 2 | Daily SMA100 | 138.93 |
| 3 | Daily SMA200 | 136.47 |
The previous day high was 146.41 while the previous day low was 145.31. The daily 38.2% Fib levels comes at 145.99, expected to provide support. Similarly, the daily 61.8% fib level is at 145.73, expected to provide support.
Note the levels of interest below:
- Pivot support is noted at 145.63, 144.92, 144.54
- Pivot resistance is noted at 146.73, 147.12, 147.83
| Levels | Levels.1 |
|---|---|
| Previous Daily High | 146.41 |
| Previous Daily Low | 145.31 |
| Previous Weekly High | 145.00 |
| Previous Weekly Low | 141.51 |
| Previous Monthly High | 144.91 |
| Previous Monthly Low | 137.24 |
| Daily Fibonacci 38.2% | 145.99 |
| Daily Fibonacci 61.8% | 145.73 |
| Daily Pivot Point S1 | 145.63 |
| Daily Pivot Point S2 | 144.92 |
| Daily Pivot Point S3 | 144.54 |
| Daily Pivot Point R1 | 146.73 |
| Daily Pivot Point R2 | 147.12 |
| Daily Pivot Point R3 | 147.83 |
[/s2If]
Download Nehcap EAWe have two EAs that are operational on our LIVE accounts.
- EA-FIX: Check out the details here. Download EA-FIX . EA-FIX is a non-grid HFT scalper.
- EA-GROWTH: High quality low dd EA using trend grids. Download EA_GROWTHJoin Our Telegram Group
")


