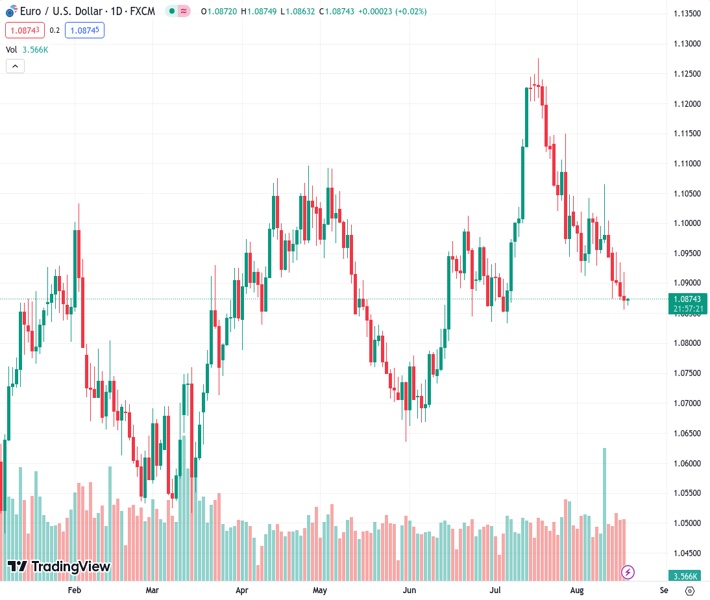
The EURUSD pair, currently at 1.08736, is finding it difficult to protect its rebound from a six-week low, and has been inactive recently.
…
This is a premium post.
[s2If !current_user_can(access_s2member_level4)]Please register for FREE REGISTER to read full post below containing analysis. In case of any error or you think you are not able to read the full post below, please email us at support#nehcap.com [lwa][/s2If] [s2If current_user_can(access_s2member_level1)]
- EUR/USD struggles to defend corrective bounce off six-week low, sidelined of late.
The pair currently trades last at 1.08736.
The previous day high was 1.0934 while the previous day low was 1.0872. The daily 38.2% Fib levels comes at 1.0896, expected to provide resistance. Similarly, the daily 61.8% fib level is at 1.091, expected to provide resistance.
EUR/USD lacks recovery momentum despite bouncing off the multi-day low as it seesaws around 1.0870-75 amid early hours of Friday’s Asian session, after refreshing the six-week low the previous day. In doing so, the Euro pair justifies the market’s risk-off mood, as well as the recently altered concerns about the Federal Reserve (Fed), to keep sellers on board.
The recently firmer US data contrasts with unimpressive Eurozone statistics and the looming concerns about German recession to keep the Euro bears hopeful. Also, the latest shift in the Fed bias joins the broad risk aversion wave to propel the yields and exert additional downside pressure on the EUR/USD pair, via firmer US Dollar.
That said, the US Dollar Index (DXY) refreshed two-month high the previous day before closing around 103.42 on Thursday.
Talking about the US data, US Philadelphia Fed Manufacturing Survey marked the strongest print since April 2022, as well as the first positive outcome in a year, while rising to 12.0 for August from -13.5 prior and -10.0 expected. On the same line, the US Initial Jobless Claims also edged lower to 239K for the week ended on August 11 versus a revised up 250K prior and the market expectations of 240K. It should be noted that the four-week average of the Initial Jobless Claims and the weekly figures of the Continuing Claims for the period ended on August 04 edged higher. Earlier in the week, the US Industrial Production and Retail Sales for July marked surprised growth but the housing numbers were mixed.
Additionally, the latest Fed Minutes showed that the most policymakers preferred supporting the battle again the ‘sticky’ inflation, despite being divided on the imminent rate hike, which in turn challenges the market’s previous policy pivot concerns about the US central bank and favor the Greenback.
At home, Eurozone trade surplus improved on seasonally adjusted (s.a) and non-seasonally adjusted (n.s.a) for June. That said, the former grew to €12.5B while the latter rose to €23B versus €0.2B and €-0.3B respective priors. Earlier in the week, Eurozone Industrial Production marked a surprise growth for June but the second readings of the Eurozone Gross Domestic Product (GDP) for the second quarter (Q2) confirmed initial forecasts whereas the Employment Change eased for the said period.
It’s worth noting that China’s second-large realtor, as well as the world’s most heavily indebted property developer, Evergrande filed for protection from creditors in a US bankruptcy court on Thursday, per Reuters. The same escalate fears surrounding the world’s second-largest economy, as well as the global economic transition, as it battles with the slowing economic recovery and concerns about the financial health of China’s biggest realtor, namely Country Garden, propel market woes of late. The same joins the hawkish Fed bias to propel the yields and the US Dollar.
Failure to cross the 1.0935-30 resistance confluence comprising the 100-DMA and a one-month-old falling trend line, despite the latest corrective bounce, keeps the EUR/USD bears hopeful of witnessing further downside of the pair. The same highlights July’s low of 1.0833 as an immediate support.
Technical Levels: Supports and Resistances
EURUSD currently trading at 1.0874 at the time of writing. Pair opened at 1.0879 and is trading with a change of -0.05 % .
| Overview | Overview.1 | |
|---|---|---|
| 0 | Today last price | 1.0874 |
| 1 | Today Daily Change | -0.0005 |
| 2 | Today Daily Change % | -0.0500 |
| 3 | Today daily open | 1.0879 |
The pair is trading below its 20 Daily moving average @ 1.0994, below its 50 Daily moving average @ 1.0973 , below its 100 Daily moving average @ 1.0931 and above its 200 Daily moving average @ 1.0785
| Trends | Trends.1 | |
|---|---|---|
| 0 | Daily SMA20 | 1.0994 |
| 1 | Daily SMA50 | 1.0973 |
| 2 | Daily SMA100 | 1.0931 |
| 3 | Daily SMA200 | 1.0785 |
The previous day high was 1.0934 while the previous day low was 1.0872. The daily 38.2% Fib levels comes at 1.0896, expected to provide resistance. Similarly, the daily 61.8% fib level is at 1.091, expected to provide resistance.
Note the levels of interest below:
- Pivot support is noted at 1.0856, 1.0832, 1.0793
- Pivot resistance is noted at 1.0919, 1.0958, 1.0982
| Levels | Levels.1 |
|---|---|
| Previous Daily High | 1.0934 |
| Previous Daily Low | 1.0872 |
| Previous Weekly High | 1.1065 |
| Previous Weekly Low | 1.0929 |
| Previous Monthly High | 1.1276 |
| Previous Monthly Low | 1.0834 |
| Daily Fibonacci 38.2% | 1.0896 |
| Daily Fibonacci 61.8% | 1.0910 |
| Daily Pivot Point S1 | 1.0856 |
| Daily Pivot Point S2 | 1.0832 |
| Daily Pivot Point S3 | 1.0793 |
| Daily Pivot Point R1 | 1.0919 |
| Daily Pivot Point R2 | 1.0958 |
| Daily Pivot Point R3 | 1.0982 |
[/s2If]
Download Nehcap EAWe have two EAs that are operational on our LIVE accounts.
- EA-FIX: Check out the details here. Download EA-FIX . EA-FIX is a non-grid HFT scalper.
- EA-GROWTH: High quality low dd EA using trend grids. Download EA_GROWTHJoin Our Telegram Group
")


