The drop of #AUDJPY at 93.3800 was impacted by China’s worsening real estate crisis and the possibility of the central bank implementing stricter policies.
…
This is a premium post.
[s2If !current_user_can(access_s2member_level4)]Please register for FREE REGISTER to read full post below containing analysis. In case of any error or you think you are not able to read the full post below, please email us at support#nehcap.com [lwa][/s2If] [s2If current_user_can(access_s2member_level1)]
- AUD/JPY’s decline was influenced by China’s deepening property crisis and potential central bank tightening.
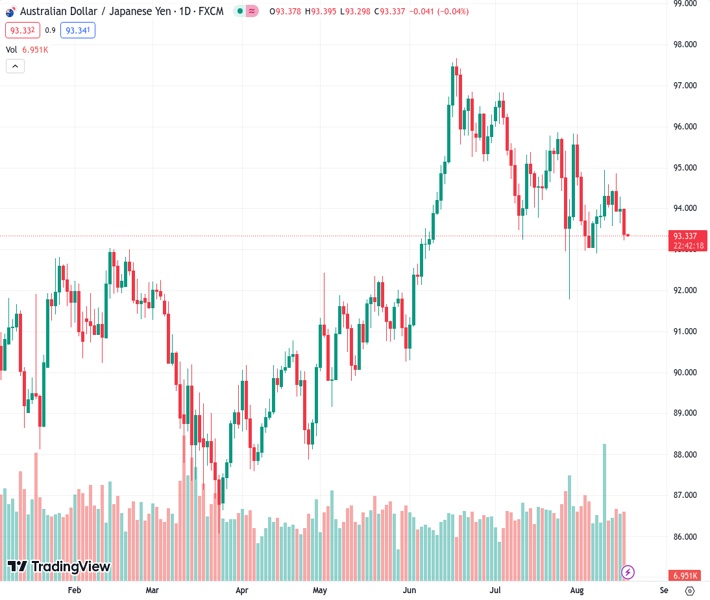
The pair currently trades last at 93.3800.
The previous day high was 94.29 while the previous day low was 93.64. The daily 38.2% Fib levels comes at 94.04, expected to provide resistance. Similarly, the daily 61.8% fib level is at 93.89, expected to provide resistance.
AUD/JPY drops in early trading in the Asian session, following Thursday’s 0.66% fall, spurred by risk-aversion amid a deep property crisis in China and speculations that central banks would keep tightening monetary conditions. Consequently, the risk-sensitive AUD/JPY pair edged down and traded at 93.34, losing 0.03%.
Another factor that underwhelmed the Australian Dollar (AUD) was a soft jobs report, with unemployment rising, a signal the labor market is cooling. This means the Reserve Bank of Australia (RBA) would keep rates unchanged towards the next monetary policy decision.
The bias turned bearish with the daily chart showing the pair falling below the Ichimoku Cloud (Kumo). In addition, the Tenkan-Sen crossed below the Kijun-Sen, while the Chikou Span sits below the price action.
Given the backdrop, the AUD/JPY’s path of least resistance is downwards, and first support emerges at the August 17 daily low of 93.21. A breach of the latter will expose the August 8 swing low of 92.89, followed by the July 20 swing low of 91.78. Once those intermediate support levels are cleared, buyers’ next line of defense is the May 31 daily low of 90.26.
Technical Levels: Supports and Resistances
AUDJPY currently trading at 93.37 at the time of writing. Pair opened at 94.01 and is trading with a change of -0.68 % .
| Overview | Overview.1 | |
|---|---|---|
| 0 | Today last price | 93.37 |
| 1 | Today Daily Change | -0.64 |
| 2 | Today Daily Change % | -0.68 |
| 3 | Today daily open | 94.01 |
The pair is trading below its 20 Daily moving average @ 94.32, below its 50 Daily moving average @ 95.0 , above its 100 Daily moving average @ 92.72 and above its 200 Daily moving average @ 91.9
| Trends | Trends.1 | |
|---|---|---|
| 0 | Daily SMA20 | 94.32 |
| 1 | Daily SMA50 | 95.00 |
| 2 | Daily SMA100 | 92.72 |
| 3 | Daily SMA200 | 91.90 |
The previous day high was 94.29 while the previous day low was 93.64. The daily 38.2% Fib levels comes at 94.04, expected to provide resistance. Similarly, the daily 61.8% fib level is at 93.89, expected to provide resistance.
Note the levels of interest below:
- Pivot support is noted at 93.67, 93.33, 93.02
- Pivot resistance is noted at 94.32, 94.63, 94.97
| Levels | Levels.1 |
|---|---|
| Previous Daily High | 94.29 |
| Previous Daily Low | 93.64 |
| Previous Weekly High | 94.94 |
| Previous Weekly Low | 92.90 |
| Previous Monthly High | 96.84 |
| Previous Monthly Low | 91.79 |
| Daily Fibonacci 38.2% | 94.04 |
| Daily Fibonacci 61.8% | 93.89 |
| Daily Pivot Point S1 | 93.67 |
| Daily Pivot Point S2 | 93.33 |
| Daily Pivot Point S3 | 93.02 |
| Daily Pivot Point R1 | 94.32 |
| Daily Pivot Point R2 | 94.63 |
| Daily Pivot Point R3 | 94.97 |
[/s2If]
Download Nehcap EAWe have two EAs that are operational on our LIVE accounts.
- EA-FIX: Check out the details here. Download EA-FIX . EA-FIX is a non-grid HFT scalper.
- EA-GROWTH: High quality low dd EA using trend grids. Download EA_GROWTHJoin Our Telegram Group
")


