The British pound strengthens as UK inflation data, despite indicating some decrease, remains at a high level, indicating that the Bank of England might take additional measures.
…
This is a premium post.
[s2If !current_user_can(access_s2member_level4)]Please register for FREE REGISTER to read full post below containing analysis. In case of any error or you think you are not able to read the full post below, please email us at support#nehcap.com [lwa][/s2If] [s2If current_user_can(access_s2member_level1)]
- Sterling gains strength as UK inflation data, although showing signs of easing, remains high, suggesting further action by the BoE.
The pair currently trades last at 0.85293.
The previous day high was 0.8593 while the previous day low was 0.8544. The daily 38.2% Fib levels comes at 0.8563, expected to provide resistance. Similarly, the daily 61.8% fib level is at 0.8575, expected to provide resistance.
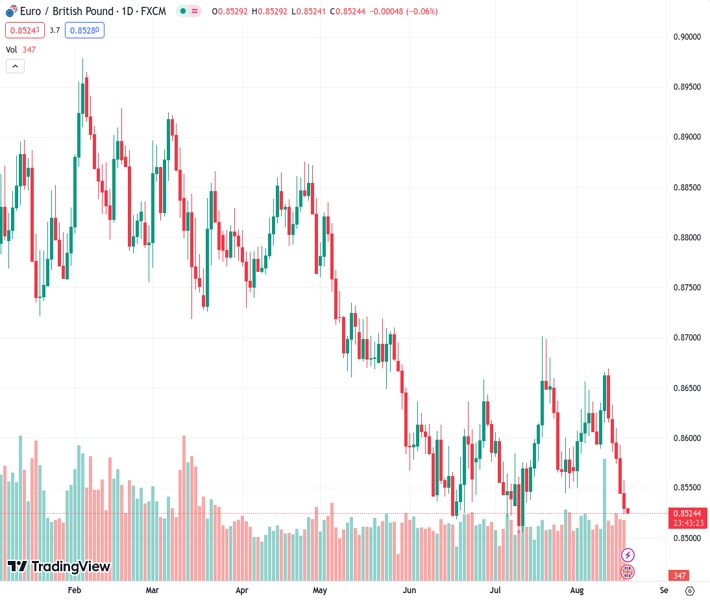
The EUR/GBP prolongs its losses to five consecutive trading days as sellers eye a challenge of the year-to-date (YTD) low of 0.8504, sponsored by overall Sterling (GBP) strength. Although UK’s inflation figures show signs of easing, is still high, warranting further tightening by the Bank of England (BoE). Therefore, the GBP remains strong, as witnessed by the EUR/GBP trading at 0.8530, down 0.17%.
The EUR/GBP daily chart portrays the pair as subdued but slightly tilted bearish after breaking previous support, cracking the July 27 daily low of 0.8544, opening the door for a deeper correction. Up next, the EUR/GBP would test the YTD low of 0.8504, which once cleared, and it would expose the 2022 August 14 low of 0.8408.
Conversely, if EUR/GBP stays above 0.8500, the next resistance would emerge at the August 15 high of 0.8593. if buyers push prices above that level, next would be the 0.8600 figure, followed by the 50 and 100-day Exponential Moving Averages (EMAs) at 0.8605 and 0.8640.
Technical Levels: Supports and Resistances
EURGBP currently trading at 0.8532 at the time of writing. Pair opened at 0.8546 and is trading with a change of -0.16 % .
| Overview | Overview.1 | |
|---|---|---|
| 0 | Today last price | 0.8532 |
| 1 | Today Daily Change | -0.0014 |
| 2 | Today Daily Change % | -0.1600 |
| 3 | Today daily open | 0.8546 |
The pair remains strongly bearish on the daily time frame. It trades below the 20 SMA @ 0.8604, 50 SMA 0.8586, 100 SMA @ 0.8663 and 200 SMA @ 0.8721.
| Trends | Trends.1 | |
|---|---|---|
| 0 | Daily SMA20 | 0.8604 |
| 1 | Daily SMA50 | 0.8586 |
| 2 | Daily SMA100 | 0.8663 |
| 3 | Daily SMA200 | 0.8721 |
The previous day high was 0.8593 while the previous day low was 0.8544. The daily 38.2% Fib levels comes at 0.8563, expected to provide resistance. Similarly, the daily 61.8% fib level is at 0.8575, expected to provide resistance.
Note the levels of interest below:
- Pivot support is noted at 0.8529, 0.8512, 0.848
- Pivot resistance is noted at 0.8578, 0.861, 0.8626
| Levels | Levels.1 |
|---|---|
| Previous Daily High | 0.8593 |
| Previous Daily Low | 0.8544 |
| Previous Weekly High | 0.8669 |
| Previous Weekly Low | 0.8590 |
| Previous Monthly High | 0.8701 |
| Previous Monthly Low | 0.8504 |
| Daily Fibonacci 38.2% | 0.8563 |
| Daily Fibonacci 61.8% | 0.8575 |
| Daily Pivot Point S1 | 0.8529 |
| Daily Pivot Point S2 | 0.8512 |
| Daily Pivot Point S3 | 0.8480 |
| Daily Pivot Point R1 | 0.8578 |
| Daily Pivot Point R2 | 0.8610 |
| Daily Pivot Point R3 | 0.8626 |
[/s2If]
Download Nehcap EAWe have two EAs that are operational on our LIVE accounts.
- EA-FIX: Check out the details here. Download EA-FIX . EA-FIX is a non-grid HFT scalper.
- EA-GROWTH: High quality low dd EA using trend grids. Download EA_GROWTHJoin Our Telegram Group
")


