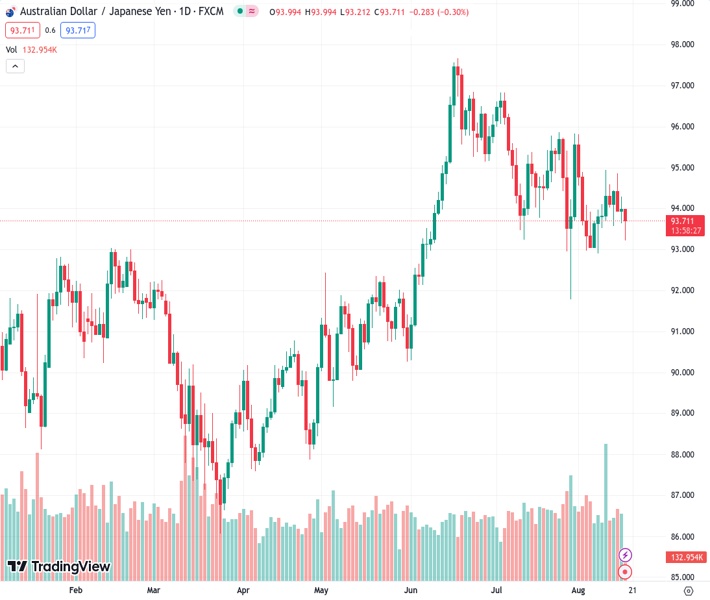
The AUDJPY pair is currently trading at 93.6830 and is moving within a downward sloping trend channel on the four-hour chart.
…
This is a premium post.
[s2If !current_user_can(access_s2member_level4)]Please register for FREE REGISTER to read full post below containing analysis. In case of any error or you think you are not able to read the full post below, please email us at support#nehcap.com [lwa][/s2If] [s2If current_user_can(access_s2member_level1)]
- AUD/JPY trades within a descending trend channel line on the four-hour chart.
The pair currently trades last at 93.6830.
The previous day high was 94.29 while the previous day low was 93.64. The daily 38.2% Fib levels comes at 94.04, expected to provide resistance. Similarly, the daily 61.8% fib level is at 93.89, expected to provide resistance.
From a technical perspective, AUD/JPY trades within a descending trend channel line from the middle of June on the four-hour chart. That said, the path of least resistance for the AUD/JPY is to the downside as the cross holds below the 50- and 100-hour Exponential Moving Averages (EMAs).
The latest data from Japan’s Ministry of Finance showed on Thursday that Exports declined 0.3% YoY, the first drop in 29 months, with a significant decline in shipments to China. While Imports dipped 13.5%, versus the 14.7% decline expected. Meanwhile, the Japanese trade deficit totaled 78.7 billion yen versus the estimation of a 24.6 billion yen deficit.
That said, the Relative Strength Index (RSI) holds below 50 while the Moving Average Convergence/Divergence (MACD) stands in bearish territory, supporting the sellers for now.
The immediate resistance level for AUD/JPY is seen at 94.00 (the 50-hour EMA, a psychological round mark). The next barrier to watch is 94.20 (the 100-hour EMA), en route to 94.60 (the upper boundary of a descending trend channel). Any meaningful follow-through buying above the latter will see a rally to 95.40 (high of July 14).
On the downside, the initial support level to watch is 93.20 (low of July 12). The key contention level is located at 93.00, representing a psychological round figure, a low of August 4. The next downside stop appears at 92.50 (low of July 18), followed by 92.15 (low of June 6). A breach of the latter will see a drop to 91.80 (the lower limit of a descending trend channel).
Technical Levels: Supports and Resistances
AUDJPY currently trading at 93.68 at the time of writing. Pair opened at 94.01 and is trading with a change of -0.35 % .
| Overview | Overview.1 | |
|---|---|---|
| 0 | Today last price | 93.68 |
| 1 | Today Daily Change | -0.33 |
| 2 | Today Daily Change % | -0.35 |
| 3 | Today daily open | 94.01 |
The pair is trading below its 20 Daily moving average @ 94.32, below its 50 Daily moving average @ 95.0 , above its 100 Daily moving average @ 92.72 and above its 200 Daily moving average @ 91.9
| Trends | Trends.1 | |
|---|---|---|
| 0 | Daily SMA20 | 94.32 |
| 1 | Daily SMA50 | 95.00 |
| 2 | Daily SMA100 | 92.72 |
| 3 | Daily SMA200 | 91.90 |
The previous day high was 94.29 while the previous day low was 93.64. The daily 38.2% Fib levels comes at 94.04, expected to provide resistance. Similarly, the daily 61.8% fib level is at 93.89, expected to provide resistance.
Note the levels of interest below:
- Pivot support is noted at 93.67, 93.33, 93.02
- Pivot resistance is noted at 94.32, 94.63, 94.97
| Levels | Levels.1 |
|---|---|
| Previous Daily High | 94.29 |
| Previous Daily Low | 93.64 |
| Previous Weekly High | 94.94 |
| Previous Weekly Low | 92.90 |
| Previous Monthly High | 96.84 |
| Previous Monthly Low | 91.79 |
| Daily Fibonacci 38.2% | 94.04 |
| Daily Fibonacci 61.8% | 93.89 |
| Daily Pivot Point S1 | 93.67 |
| Daily Pivot Point S2 | 93.33 |
| Daily Pivot Point S3 | 93.02 |
| Daily Pivot Point R1 | 94.32 |
| Daily Pivot Point R2 | 94.63 |
| Daily Pivot Point R3 | 94.97 |
[/s2If]
Download Nehcap EAWe have two EAs that are operational on our LIVE accounts.
- EA-FIX: Check out the details here. Download EA-FIX . EA-FIX is a non-grid HFT scalper.
- EA-GROWTH: High quality low dd EA using trend grids. Download EA_GROWTHJoin Our Telegram Group
")


