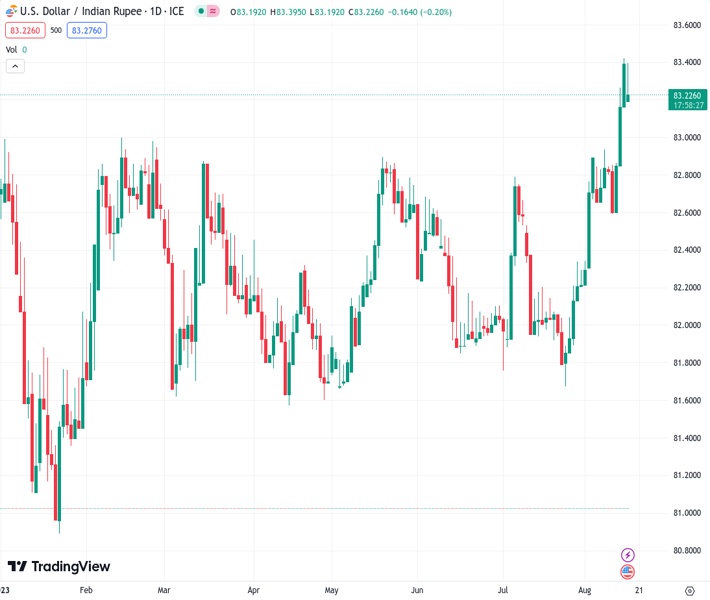
The USDINR currency pair is facing difficulties in finding a clear trend after reaching a new record high, but it has shown some slight downward movement recently.
…
This is a premium post.
[s2If !current_user_can(access_s2member_level4)]Please register for FREE REGISTER to read full post below containing analysis. In case of any error or you think you are not able to read the full post below, please email us at support#nehcap.com [lwa][/s2If] [s2If current_user_can(access_s2member_level1)]
- USD/INR struggles for clear directions after refreshing all-time high, mildly offered of late.
The pair currently trades last at 83.2450.
The previous day high was 83.5066 while the previous day low was 83.0915. The daily 38.2% Fib levels comes at 83.3481, expected to provide resistance. Similarly, the daily 61.8% fib level is at 83.2501, expected to provide resistance.
USD/INR prints mild losses around 83.30-25 as the Indian Rupee (INR) licks its wounds around the record low on early Wednesday. In doing so, the Asian currency justifies the market’s consolidation ahead of the Fed Minutes while also cheering downbeat WTI crude oil prices, India’s major import burden.
That said, a pullback in the benchmark US 10-year Treasury bond yields from the yearly high joins a pause in the downside of the US stock futures and mixed performance of the Asia-Pacific shares to portray the market’s cautious optimism.
WTI crude oil drops half a percent to $80.25 by the press time as energy bears prod the one-week low marked the previous day amid fears of receding demand from China, one of the world’s biggest oil customers.
Elsewhere, the US Dollar Index (DXY) seesaws around 103.20 while poking a five-month-old descending resistance line at the highest level in a month.
It should be observed that China’s downbeat statistics for July joined the People’s Bank of China’s (PBoC) surprise rate cuts and looming credit rating downgrade of the major US companies to weigh on the sentiment and challenge the USD/INR pair’s latest retreat.
Even so, upbeat US data and the hawkish Fed talks also weigh on the Euro prices. That said, the US Retail Sales grew 0.7% MoM in July versus 0.4% expected and 0.3% reported in June (revised from 0.2%). The details suggested that the Core Retail Sales, namely the Retail Sales ex Autos, grew 1.0% versus 0.4% market forecasts whereas the Retail Sales Control Group doubled from 0.5% previous readouts (revised from 0.6%) to 1.0% for the said month. Further, the US NY Empire State Manufacturing Index slumped to -19.0 from 1.1 prior and -1.0 market forecasts while the US Export Price Index and Import Price Index improved on MoM in July but edged lower on a yearly basis for the said month. Late Wednesday, Minneapolis Federal Reserve President Neel Kashkari ruled out talks of policy pivot by citing hot inflation and the uncertainty about the Fed’s progress in taming the same. The policymaker also said that he is not ready to say that the Fed is done raising rates, per Reuters.
It should be noted that the early-week releases of upbeat India inflation numbers contrast with the Reserve Bank of India’s (RBI) inaction to challenge the USD/INR pair’s latest retreat.
Looking ahead, US Industrial Production for July and housing numbers may entertain USD/INR pair traders before the Federal Open Market Committee’s (FOMC) latest Monetary Policy Meeting Minutes. That said, the FOMC members’ readiness for a rate hike before the policy pivot can fuel the Indian Rupee pair further toward the north.
Although the overbought RSI (14) line challenges USD/INR bulls, the pair’s downside remains elusive unless breaking the ascending resistance line from November 2022, now immediate support near the 83.00 round figure.
Technical Levels: Supports and Resistances
USDINR currently trading at 83.2405 at the time of writing. Pair opened at 83.3765 and is trading with a change of -0.16% % .
| Overview | Overview.1 | |
|---|---|---|
| 0 | Today last price | 83.2405 |
| 1 | Today Daily Change | -0.1360 |
| 2 | Today Daily Change % | -0.16% |
| 3 | Today daily open | 83.3765 |
The pair remains strongly bullish on the daily timeframe. It trades above its 20 SMA @ 82.536, 50 SMA 82.3179, 100 SMA @ 82.2456 and 200 SMA @ 82.1903.
| Trends | Trends.1 | |
|---|---|---|
| 0 | Daily SMA20 | 82.5360 |
| 1 | Daily SMA50 | 82.3179 |
| 2 | Daily SMA100 | 82.2456 |
| 3 | Daily SMA200 | 82.1903 |
The previous day high was 83.5066 while the previous day low was 83.0915. The daily 38.2% Fib levels comes at 83.3481, expected to provide resistance. Similarly, the daily 61.8% fib level is at 83.2501, expected to provide resistance.
Note the levels of interest below:
- Pivot support is noted at 83.1431, 82.9097, 82.728
- Pivot resistance is noted at 83.5583, 83.74, 83.9734
| Levels | Levels.1 |
|---|---|
| Previous Daily High | 83.5066 |
| Previous Daily Low | 83.0915 |
| Previous Weekly High | 83.0466 |
| Previous Weekly Low | 82.5854 |
| Previous Monthly High | 82.8334 |
| Previous Monthly Low | 81.6588 |
| Daily Fibonacci 38.2% | 83.3481 |
| Daily Fibonacci 61.8% | 83.2501 |
| Daily Pivot Point S1 | 83.1431 |
| Daily Pivot Point S2 | 82.9097 |
| Daily Pivot Point S3 | 82.7280 |
| Daily Pivot Point R1 | 83.5583 |
| Daily Pivot Point R2 | 83.7400 |
| Daily Pivot Point R3 | 83.9734 |
[/s2If]
Download Nehcap EAWe have two EAs that are operational on our LIVE accounts.
- EA-FIX: Check out the details here. Download EA-FIX . EA-FIX is a non-grid HFT scalper.
- EA-GROWTH: High quality low dd EA using trend grids. Download EA_GROWTHJoin Our Telegram Group
")


