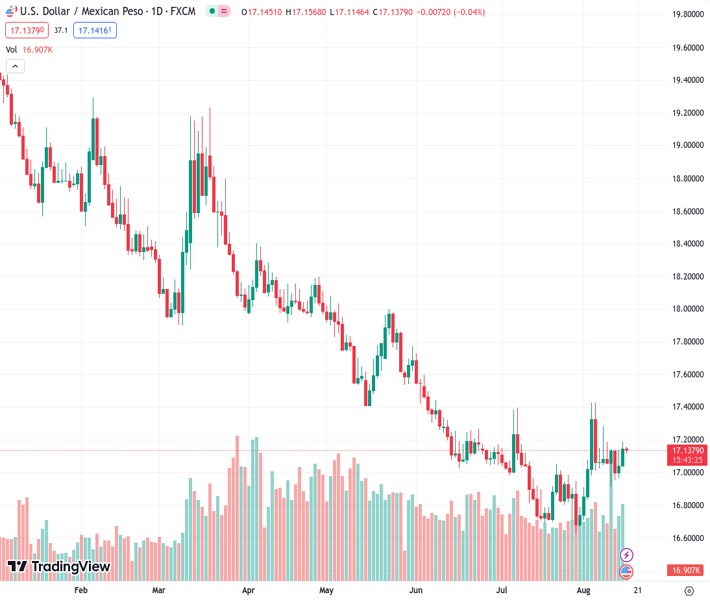
The US dollar to Mexican peso exchange rate, currently at 17.1367, is facing difficulty in maintaining its two-day streak of gains before the release of the Federal Reserve meeting minutes. According to the viewpoint of Nehcap, it is anticipated that there will be further upward movement in the exchange rate.
…
This is a premium post.
[s2If !current_user_can(access_s2member_level4)]Please register for FREE REGISTER to read full post below containing analysis. In case of any error or you think you are not able to read the full post below, please email us at support#nehcap.com [lwa][/s2If] [s2If current_user_can(access_s2member_level1)]
- USD/MXN struggles to defend two-day winning streak ahead of Fed Minutes.
The pair currently trades last at 17.1367.
The previous day high was 17.1888 while the previous day low was 17.0388. The daily 38.2% Fib levels comes at 17.1315, expected to provide support. Similarly, the daily 61.8% fib level is at 17.0961, expected to provide support.
USD/MXN retreats to 17.35 as bulls struggle to keep the reins amid the market’s consolidation ahead of the Federal Reserve’s (Fed) monetary policy meeting minutes. That said, the Mexican Peso (MXN) pair drops for the first day so far in three while fading the previous day’s rebound from the 200-Hour Moving Average (HMA).
It’s worth noting, however, that the 50-HMA is closing in on the 200-HMA from below and portrays a looming bull cross to lure the USD/MXN buyers.
Also suggesting the quote’s further upside is the RSI (14) line that stays sturdy beyond the 50.0 level.
Even so, the USD/MXN bulls need to cross the one-week-old falling resistance line surrounding 17.20, as well as gain support from the dovish minutes of the Federal Open Market Committee’s (FOMC) latest Monetary Policy Meeting Minutes, to retake control.
Following that, a horizontal area comprising levels marked since August 04, near 17.30, can prod the USD/MXN pair’s further upside before marking a run-up toward the monthly peak of near 17.42.
On the flip side, the 200-HMA and the 50-HMA restrict the immediate downside of the Mexican Peso pair to around 17.09-08.
In a case where the USD/MXN drops below the 17.08 support line, a convergence of an upward-sloping trend line from July 28 and the 50% Fibonacci retracement of late July to early August upside, near the 17.00 threshold, appears a tough nut to crack for the bears.
Trend: Further upside expected
Technical Levels: Supports and Resistances
USDMXN currently trading at 17.1359 at the time of writing. Pair opened at 17.1479 and is trading with a change of -0.07% % .
| Overview | Overview.1 | |
|---|---|---|
| 0 | Today last price | 17.1359 |
| 1 | Today Daily Change | -0.0120 |
| 2 | Today Daily Change % | -0.07% |
| 3 | Today daily open | 17.1479 |
The pair is trading above its 20 Daily moving average @ 16.9706, above its 50 Daily moving average @ 17.0429 , below its 100 Daily moving average @ 17.4596 and below its 200 Daily moving average @ 18.2262
| Trends | Trends.1 | |
|---|---|---|
| 0 | Daily SMA20 | 16.9706 |
| 1 | Daily SMA50 | 17.0429 |
| 2 | Daily SMA100 | 17.4596 |
| 3 | Daily SMA200 | 18.2262 |
The previous day high was 17.1888 while the previous day low was 17.0388. The daily 38.2% Fib levels comes at 17.1315, expected to provide support. Similarly, the daily 61.8% fib level is at 17.0961, expected to provide support.
Note the levels of interest below:
- Pivot support is noted at 17.0615, 16.9751, 16.9114
- Pivot resistance is noted at 17.2116, 17.2752, 17.3616
| Levels | Levels.1 |
|---|---|
| Previous Daily High | 17.1888 |
| Previous Daily Low | 17.0388 |
| Previous Weekly High | 17.2852 |
| Previous Weekly Low | 16.9101 |
| Previous Monthly High | 17.3957 |
| Previous Monthly Low | 16.6258 |
| Daily Fibonacci 38.2% | 17.1315 |
| Daily Fibonacci 61.8% | 17.0961 |
| Daily Pivot Point S1 | 17.0615 |
| Daily Pivot Point S2 | 16.9751 |
| Daily Pivot Point S3 | 16.9114 |
| Daily Pivot Point R1 | 17.2116 |
| Daily Pivot Point R2 | 17.2752 |
| Daily Pivot Point R3 | 17.3616 |
[/s2If]
Download Nehcap EAWe have two EAs that are operational on our LIVE accounts.
- EA-FIX: Check out the details here. Download EA-FIX . EA-FIX is a non-grid HFT scalper.
- EA-GROWTH: High quality low dd EA using trend grids. Download EA_GROWTHJoin Our Telegram Group
")


