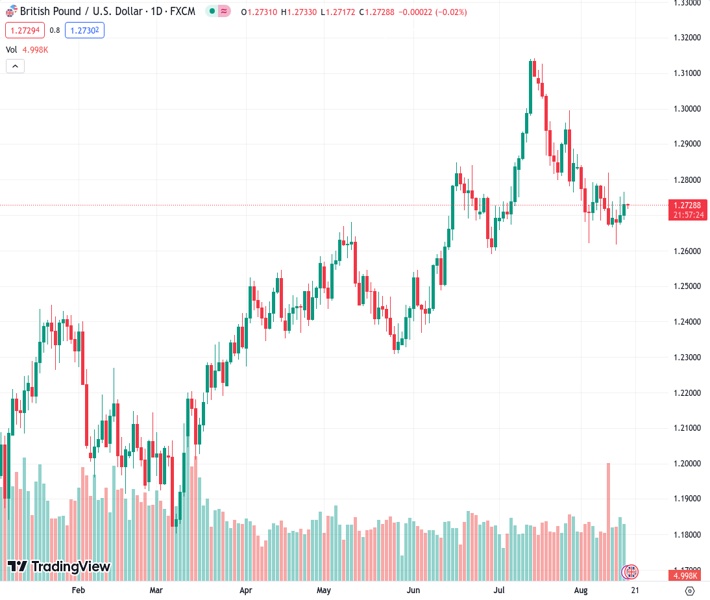
The GBP/USD pair, currently trading at 1.27295, is showing signs of recovery as it defends against downward movement from the 100-day moving average at its weekly high. It is also testing a declining resistance line that is one month old. According to the opinion of @nehcap, there is not much potential for significant gains in the near future.
…
This is a premium post.
[s2If !current_user_can(access_s2member_level4)]Please register for FREE REGISTER to read full post below containing analysis. In case of any error or you think you are not able to read the full post below, please email us at support#nehcap.com [lwa][/s2If] [s2If current_user_can(access_s2member_level1)]
- GBP/USD defends rebound from 100-DMA at weekly top, prods one-month-old falling resistance line.
The pair currently trades last at 1.27295.
The previous day high was 1.2752 while the previous day low was 1.2675. The daily 38.2% Fib levels comes at 1.2723, expected to provide support. Similarly, the daily 61.8% fib level is at 1.2705, expected to provide support.
GBP/USD edges higher past 1.2700 as it flirts with the weekly top surrounding 1.2730 amid the early hours of Thursday’s Asian session. In doing so, the Cable pair defends Monday’s U-turn from the 100-DMA while approaching a downward-sloping resistance line from July 14 after a three-day winning streak.
Not only a rebound from the 100-DMA but the impending bull cross on the MACD also underpins the upside bias about the Pound Sterling.
However, a clear break of the stated resistance line, close to 1.2750 by the press time, isn’t an open invitation to the Cable buyers as the 50-DMA hurdle of around 1.2785 prods the short-term advances of the quote.
Following that, a 5.5-month-old previous support line, now resistance around 1.2850, acts as the final defense of the GBP/USD bears.
Meanwhile, the broadly firmer US Dollar, backed by the upbeat Fed Minutes and yields of late, challenge the Pound Sterling buyers and tease a pullback toward the 100-DMA retest, especially amid a light calendar on Thursday. That said, the 100-DMA level is around 1.2625 by the press time.
In a case where the GBP/USD pair remains bearish past 1.2625, the weekly bottom of 1.2616 and the late June trough surrounding 1.2590 will test the sellers before giving them control.
Trend: Limited upside expected
Technical Levels: Supports and Resistances
GBPUSD currently trading at 1.2731 at the time of writing. Pair opened at 1.2704 and is trading with a change of 0.21% % .
| Overview | Overview.1 | |
|---|---|---|
| 0 | Today last price | 1.2731 |
| 1 | Today Daily Change | 0.0027 |
| 2 | Today Daily Change % | 0.21% |
| 3 | Today daily open | 1.2704 |
The pair is trading below its 20 Daily moving average @ 1.2789, below its 50 Daily moving average @ 1.2775 , above its 100 Daily moving average @ 1.2616 and above its 200 Daily moving average @ 1.2362
| Trends | Trends.1 | |
|---|---|---|
| 0 | Daily SMA20 | 1.2789 |
| 1 | Daily SMA50 | 1.2775 |
| 2 | Daily SMA100 | 1.2616 |
| 3 | Daily SMA200 | 1.2362 |
The previous day high was 1.2752 while the previous day low was 1.2675. The daily 38.2% Fib levels comes at 1.2723, expected to provide support. Similarly, the daily 61.8% fib level is at 1.2705, expected to provide support.
Note the levels of interest below:
- Pivot support is noted at 1.2669, 1.2634, 1.2592
- Pivot resistance is noted at 1.2746, 1.2788, 1.2823
| Levels | Levels.1 |
|---|---|
| Previous Daily High | 1.2752 |
| Previous Daily Low | 1.2675 |
| Previous Weekly High | 1.2819 |
| Previous Weekly Low | 1.2666 |
| Previous Monthly High | 1.3142 |
| Previous Monthly Low | 1.2659 |
| Daily Fibonacci 38.2% | 1.2723 |
| Daily Fibonacci 61.8% | 1.2705 |
| Daily Pivot Point S1 | 1.2669 |
| Daily Pivot Point S2 | 1.2634 |
| Daily Pivot Point S3 | 1.2592 |
| Daily Pivot Point R1 | 1.2746 |
| Daily Pivot Point R2 | 1.2788 |
| Daily Pivot Point R3 | 1.2823 |
[/s2If]
Download Nehcap EAWe have two EAs that are operational on our LIVE accounts.
- EA-FIX: Check out the details here. Download EA-FIX . EA-FIX is a non-grid HFT scalper.
- EA-GROWTH: High quality low dd EA using trend grids. Download EA_GROWTHJoin Our Telegram Group
")


