The EURUSD currency pair remains at its lowest level in a month and a half due to the overall strength of the US Dollar.
…
This is a premium post.
[s2If !current_user_can(access_s2member_level4)]Please register for FREE REGISTER to read full post below containing analysis. In case of any error or you think you are not able to read the full post below, please email us at support#nehcap.com [lwa][/s2If] [s2If current_user_can(access_s2member_level1)]
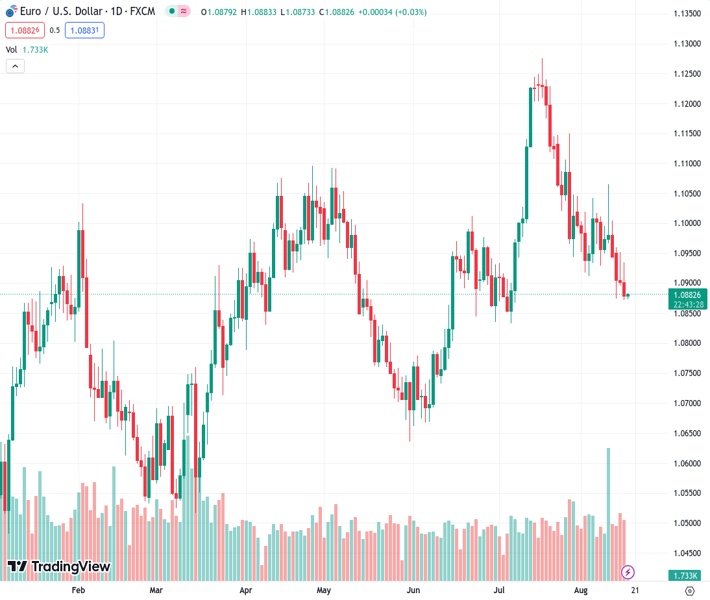
- EUR/USD languishes at 1.5-month low amid broad US Dollar strength.
The pair currently trades last at 1.08829.
The previous day high was 1.0952 while the previous day low was 1.0897. The daily 38.2% Fib levels comes at 1.0931, expected to provide resistance. Similarly, the daily 61.8% fib level is at 1.0918, expected to provide resistance.
EUR/USD bears take a breather at the lowest level in six weeks while seeking fresh clues to extend the previous day’s fall amid early Thursday morning in Asia. That said, the Euro pair refreshed the multi-day low to 1.0871 late Wednesday after the Monetary Policy Meeting Minutes of the Federal Open Market Committee (FOMC) appeared hawkish. Also weighing on the pair was the major US Dollar strength backed by the firmer US Treasury bond yields and sour sentiment, not to forget mostly upbeat US data.
The late Fed Minutes showed the FOMC members’ division about the rate hike trajectory but marked union when it came to the inflation fears, which in turn appeared hawkish and favored the US Dollar. “Federal Reserve officials were divided over the need for more interest rate hikes at the U.S. central bank’s July 25–26 meeting, with ‘some participants’ citing the risks to the economy of pushing rates too far even as ‘most’ policymakers continued to prioritize the battle against inflation,” said Reuters.
That said, the US Industrial Production marked a surprise 1.0% growth for July versus 0.3% expected and -0.8% prior while the Capacity Utilization for the said month also improved to 79.3% from 78.6%, compared to market forecasts of 79.1%. Further, the Building Permits edged higher to 1.442M for July from 1.441M whereas the Housing Starts rose to 1.452M for the said month versus 1.398M prior and 1.448M expected. It’s worth noting that both the
Building Permits Change and Housing Starts Change improved more than market forecasts and previous readings. Previously, the US Retail Sales grew 0.7% MoM in July versus 0.4% expected and 0.3% reported in June (revised from 0.2%) and suggested strong consumer spending, mainly due to improved wages, which in turn favored the US Dollar to stay firmer amid early weekdays.
On the other hand, Eurozone Industrial Production for June marked an unexpected growth of 0.5% MoM versus -0.1% market forecasts and 0.0% previous readings. On the same line, the yearly Industrial Output figures improved to -1.2% YoY from -2.5% marked in May, versus -4.2% anticipated. Further, the second readings of the Eurozone Gross Domestic Product (GDP) for the second quarter (Q2) confirmed the 0.3% QoQ and 0.6% YoY initial estimations but the first readings of the Employment Change eased for the said period.
It’s worth mentioning that the growing fears from China and the chatters about the softer growth in developed economies, backed by the global rating agency Fitch Ratings, weigh on the sentiment and allowed the US Dollar to remain firmer at the highest level in a month.
Against this backdrop, Wall Street closed in the red and the US 10-year Treasury bond yields refreshed their yearly high during the five-day uptrend.
Moving on, a light calendar may allow the Euro pair to consolidate the latest moves but that needs validation from the Eurozone trade numbers, US weekly jobless claims and Philadelphia Fed Manufacturing Survey, not to forget the aforementioned risk catalysts.
A sustained downside break of the 100-DMA, around 1.0935 by the press time, directs EUR/USD toward an ascending support line stretched from November 2022, close to 1.0830 amid bearish MACD signals. That said, the RSI conditions prod the Euro pair’s downside afterward.
Technical Levels: Supports and Resistances
EURUSD currently trading at 1.0882 at the time of writing. Pair opened at 1.0907 and is trading with a change of -0.23% % .
| Overview | Overview.1 | |
|---|---|---|
| 0 | Today last price | 1.0882 |
| 1 | Today Daily Change | -0.0025 |
| 2 | Today Daily Change % | -0.23% |
| 3 | Today daily open | 1.0907 |
The pair is trading below its 20 Daily moving average @ 1.101, below its 50 Daily moving average @ 1.097 , below its 100 Daily moving average @ 1.0931 and above its 200 Daily moving average @ 1.0781
| Trends | Trends.1 | |
|---|---|---|
| 0 | Daily SMA20 | 1.1010 |
| 1 | Daily SMA50 | 1.0970 |
| 2 | Daily SMA100 | 1.0931 |
| 3 | Daily SMA200 | 1.0781 |
The previous day high was 1.0952 while the previous day low was 1.0897. The daily 38.2% Fib levels comes at 1.0931, expected to provide resistance. Similarly, the daily 61.8% fib level is at 1.0918, expected to provide resistance.
Note the levels of interest below:
- Pivot support is noted at 1.0885, 1.0864, 1.083
- Pivot resistance is noted at 1.094, 1.0974, 1.0996
| Levels | Levels.1 |
|---|---|
| Previous Daily High | 1.0952 |
| Previous Daily Low | 1.0897 |
| Previous Weekly High | 1.1065 |
| Previous Weekly Low | 1.0929 |
| Previous Monthly High | 1.1276 |
| Previous Monthly Low | 1.0834 |
| Daily Fibonacci 38.2% | 1.0931 |
| Daily Fibonacci 61.8% | 1.0918 |
| Daily Pivot Point S1 | 1.0885 |
| Daily Pivot Point S2 | 1.0864 |
| Daily Pivot Point S3 | 1.0830 |
| Daily Pivot Point R1 | 1.0940 |
| Daily Pivot Point R2 | 1.0974 |
| Daily Pivot Point R3 | 1.0996 |
[/s2If]
Download Nehcap EAWe have two EAs that are operational on our LIVE accounts.
- EA-FIX: Check out the details here. Download EA-FIX . EA-FIX is a non-grid HFT scalper.
- EA-GROWTH: High quality low dd EA using trend grids. Download EA_GROWTHJoin Our Telegram Group
")


