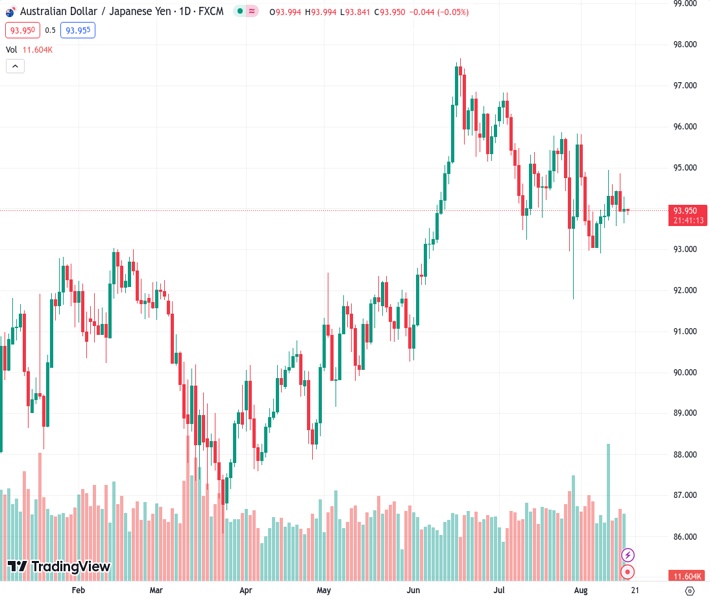
The currency pair AUDJPY is currently trading close to the lowest levels of the week, and there is a chance that it may move towards the lower boundary of the Ichimoku Cloud (Kumo).
…
This is a premium post.
[s2If !current_user_can(access_s2member_level4)]Please register for FREE REGISTER to read full post below containing analysis. In case of any error or you think you are not able to read the full post below, please email us at support#nehcap.com [lwa][/s2If] [s2If current_user_can(access_s2member_level1)]
- AUD/JPY trades near the week’s lows, with a potential move toward the bottom of the Ichimoku Cloud (Kumo).
The pair currently trades last at 93.9380.
The previous day high was 94.87 while the previous day low was 93.93. The daily 38.2% Fib levels comes at 94.29, expected to provide resistance. Similarly, the daily 61.8% fib level is at 94.51, expected to provide resistance.
AUD/JPY sits near the week’s lows and threatens to extend its losses toward the bottom of the Ichimoku Cloud (Kumo) as Thursday’s Asian session begins. At the time of writing, the AUD/JPY is exchanging hands at 93.97, registering minuscule losses of 0.03%.
The AUD/JPY daily chart portrays the pair neutral-bearish, set to stay within the Kumo amid the lack of a catalyst that could trigger a downward break. The AUD/JPY remains in a downward mode after achieving successive series of lower highs and lower lows, seeing as a sign of a downtrend. Unless buyers reclaim the July 31 daily high of 95.82, the AUD/JPY pair could test the bottom of the Kumo at 93.40.
Short term, the AUD/JPY hourly chart portrays the pair as bearish biased, as price action lies below the Kumo. In addition, the Tenkan and Kijun-Sen lines lie above the spot price, acting as resistance levels, each at 93.95 and 93.97.
Nevertheless, from a pure price action point of view, the AUD/JPY is forming a descending triangle, which could pave the way for further losses. A breach of the bottom trendline will expose 93.79 as the first support, followed by the August 16 daily low of 93.63. Once those levels are cleared, the next support would emerge at an August 8 daily low of 92.89.
Technical Levels: Supports and Resistances
AUDJPY currently trading at 93.96 at the time of writing. Pair opened at 93.96 and is trading with a change of 0.0 % .
| Overview | Overview.1 | |
|---|---|---|
| 0 | Today last price | 93.96 |
| 1 | Today Daily Change | 0.00 |
| 2 | Today Daily Change % | 0.00 |
| 3 | Today daily open | 93.96 |
The pair is trading below its 20 Daily moving average @ 94.35, below its 50 Daily moving average @ 94.98 , above its 100 Daily moving average @ 92.67 and above its 200 Daily moving average @ 91.91
| Trends | Trends.1 | |
|---|---|---|
| 0 | Daily SMA20 | 94.35 |
| 1 | Daily SMA50 | 94.98 |
| 2 | Daily SMA100 | 92.67 |
| 3 | Daily SMA200 | 91.91 |
The previous day high was 94.87 while the previous day low was 93.93. The daily 38.2% Fib levels comes at 94.29, expected to provide resistance. Similarly, the daily 61.8% fib level is at 94.51, expected to provide resistance.
Note the levels of interest below:
- Pivot support is noted at 93.64, 93.31, 92.7
- Pivot resistance is noted at 94.58, 95.2, 95.52
| Levels | Levels.1 |
|---|---|
| Previous Daily High | 94.87 |
| Previous Daily Low | 93.93 |
| Previous Weekly High | 94.94 |
| Previous Weekly Low | 92.90 |
| Previous Monthly High | 96.84 |
| Previous Monthly Low | 91.79 |
| Daily Fibonacci 38.2% | 94.29 |
| Daily Fibonacci 61.8% | 94.51 |
| Daily Pivot Point S1 | 93.64 |
| Daily Pivot Point S2 | 93.31 |
| Daily Pivot Point S3 | 92.70 |
| Daily Pivot Point R1 | 94.58 |
| Daily Pivot Point R2 | 95.20 |
| Daily Pivot Point R3 | 95.52 |
[/s2If]
Download Nehcap EAWe have two EAs that are operational on our LIVE accounts.
- EA-FIX: Check out the details here. Download EA-FIX . EA-FIX is a non-grid HFT scalper.
- EA-GROWTH: High quality low dd EA using trend grids. Download EA_GROWTHJoin Our Telegram Group
")


