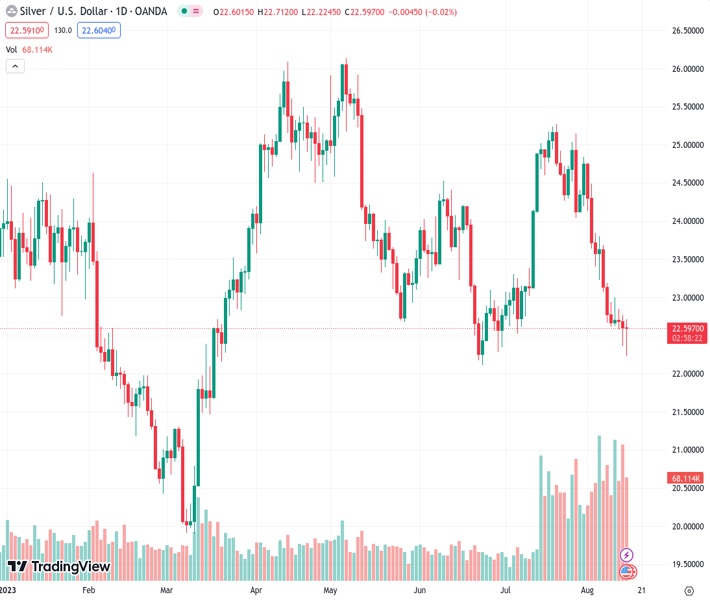
The XAGUSD currency pair hit a support level at a daily low of $22.20 and subsequently made a comeback towards $22.55, remaining unchanged in trading.
…
This is a premium post.
[s2If !current_user_can(access_s2member_level4)]Please register for FREE REGISTER to read full post below containing analysis. In case of any error or you think you are not able to read the full post below, please email us at support#nehcap.com [lwa][/s2If] [s2If current_user_can(access_s2member_level1)]
- XAG/USD found support at a daily low of $22.20, then recovered towards $22.55, trading flat.
The pair currently trades last at 22.584.
The previous day high was 22.76 while the previous day low was 22.37. The daily 38.2% Fib levels comes at 22.52, expected to provide support. Similarly, the daily 61.8% fib level is at 22.61, expected to provide resistance.
On Tuesday, the XAG/USD cleared daily gains and its losses were limited by the USD consolidating its previous day’s gains. Focus now shifts to the July meeting’s Federal Open Market Committee (FOMC) minutes.
US Retail Sales showed the US economy is holding firm. The headline Sales rose by 0.7% MoM, higher than the 0.4% expected, while the ones excluding the Automobile sector also came in strong and came in at 1% vs the 0.4% expected.
Regarding the next Federal Reserve (Fed) meeting, there’s a prevailing market expectation of a no hike in September. However, the chances of a 25 basis point adjustment in November reach a peak of around 40%. That said, the focus now pivots to Wednesday’s Federal Open Market Committee (FOMC) gathering, as investors seek hints in the forward guidance to attain a distinct perspective on the officials’ position.
Considering this, the US bond yields, considered the opportunity cost of holding Silver, are edging lower. The 10-year bond yield trades at 4.18%, down by 0.62 % losses on the day. The 2-year yield stands at 4.95% with 0.81 % losses, and the 5-year yield is at 4.33% with 0.62 % losses.
The technical analysis of the daily chart suggests a neutral to bearish stance for XAG/USD as the bears work on staging a recovery and exerting their influence. Having turned flat in negative territory, the Relative Strength Index (RSI) suggests a potential market equilibrium with balanced selling and buying pressure. At the same time, the Moving Average Convergence (MACD) shows flat red bars. In addition, the pair is below the 20,100 and 200-day Simple Moving Averages (SMAs), highlighting the continued dominance of bears on the broader scale, requiring the buyers to take action.
Support levels: $22.15, $22.00, $21.80.
Resistance levels: $23.30 (200-day SMA), $23.50, $24.00.
Technical Levels: Supports and Resistances
XAGUSD currently trading at 22.6 at the time of writing. Pair opened at 22.6 and is trading with a change of 0.0 % .
| Overview | Overview.1 | |
|---|---|---|
| 0 | Today last price | 22.6 |
| 1 | Today Daily Change | 0.0 |
| 2 | Today Daily Change % | 0.0 |
| 3 | Today daily open | 22.6 |
The pair remains strongly bearish on the daily time frame. It trades below the 20 SMA @ 23.93, 50 SMA 23.64, 100 SMA @ 24.05 and 200 SMA @ 23.26.
| Trends | Trends.1 | |
|---|---|---|
| 0 | Daily SMA20 | 23.93 |
| 1 | Daily SMA50 | 23.64 |
| 2 | Daily SMA100 | 24.05 |
| 3 | Daily SMA200 | 23.26 |
The previous day high was 22.76 while the previous day low was 22.37. The daily 38.2% Fib levels comes at 22.52, expected to provide support. Similarly, the daily 61.8% fib level is at 22.61, expected to provide resistance.
Note the levels of interest below:
- Pivot support is noted at 22.39, 22.18, 21.99
- Pivot resistance is noted at 22.79, 22.97, 23.18
| Levels | Levels.1 |
|---|---|
| Previous Daily High | 22.76 |
| Previous Daily Low | 22.37 |
| Previous Weekly High | 23.68 |
| Previous Weekly Low | 22.58 |
| Previous Monthly High | 25.27 |
| Previous Monthly Low | 22.52 |
| Daily Fibonacci 38.2% | 22.52 |
| Daily Fibonacci 61.8% | 22.61 |
| Daily Pivot Point S1 | 22.39 |
| Daily Pivot Point S2 | 22.18 |
| Daily Pivot Point S3 | 21.99 |
| Daily Pivot Point R1 | 22.79 |
| Daily Pivot Point R2 | 22.97 |
| Daily Pivot Point R3 | 23.18 |
[/s2If]
Download Nehcap EAWe have two EAs that are operational on our LIVE accounts.
- EA-FIX: Check out the details here. Download EA-FIX . EA-FIX is a non-grid HFT scalper.
- EA-GROWTH: High quality low dd EA using trend grids. Download EA_GROWTHJoin Our Telegram Group
")


