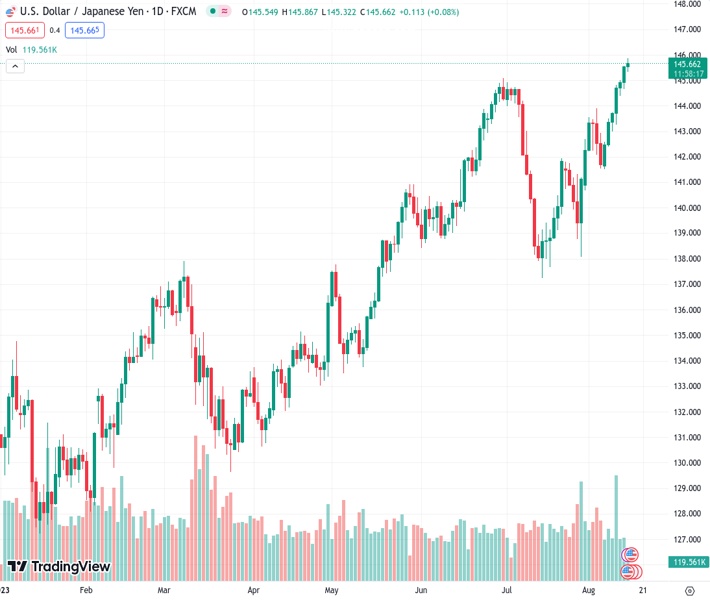
The USDJPY pair has continued to rise for a seventh consecutive day, reaching a new peak for the year on Tuesday, with a value of 145.612.
…
This is a premium post.
[s2If !current_user_can(access_s2member_level4)]Please register for FREE REGISTER to read full post below containing analysis. In case of any error or you think you are not able to read the full post below, please email us at support#nehcap.com [lwa][/s2If] [s2If current_user_can(access_s2member_level1)]
- USD/JPY scales higher for the seventh straight day and hits a fresh YTD peak on Tuesday.
The pair currently trades last at 145.612.
The previous day high was 145.58 while the previous day low was 144.65. The daily 38.2% Fib levels comes at 145.23, expected to provide support. Similarly, the daily 61.8% fib level is at 145.01, expected to provide support.
The USD/JPY pair gains some positive traction for the seventh successive day on Tuesday and climbs to its highest level since November 2022, around the 145.85 region during the early part of the European session.
The Japanese Yen (JPY) continues with its underperformance in the wake of a more dovish stance adopted by the Bank of Japan (BoJ), which is the only central bank in the world to maintain a negative benchmark interest rate. This, in turn, is seen as a key factor acting as a tailwind for the USD/JPY pair amid the underlying bullish tone around the US Dollar (USD), supported by expectations that the Federal Reserve (Fed) will keep rates higher for longer.
Even the upbeat Japanese GDP report, showing that the economy expanded by 1.5% during the second quarter and a 6% annualized pace, fails to provide any respite to the JPY. That said, speculations for a possible intervention by Japanese authorities to curb any further fall in the domestic currency hold back bulls from placing fresh bets. The fundamental backdrop, however, suggests that the path of least resistance for the USD/JPY pair is to the upside.
From a technical perspective, the recent strong move-up witnessed over the past one-and-half week or so has been along an upward sloping trend-channel. This, along with last week’s breakout through the 145.00 psychological mark, adds credence to the positive outlook for the USD/JPY pair. That said, the Relative Strength Index (RSI) on the 1-hour chart is flashing slightly overbought conditions and warrants caution for bullish traders.
Hence, any subsequent move up is more likely to confront stiff resistance and remain capped near the 146.00 mark, representing the top boundary of the aforementioned trend channel. The said handle should act as a pivotal point, which if cleared will be seen as a fresh trigger for bullish traders and lift the USD/JPY pair beyond an intermediate hurdle near the 146.35 area, towards the 146.75-146.80 region en route to the 147.00 round figure.
On the flip side, any meaningful corrective decline might now find decent support near the 145.00 resistance breakpoint. This is followed by the lower end of the ascending channel, currently pegged around the 144.60 region. A convincing break below the latter might negate the constructive setup and shift the near-term bias in favour of bearish traders. The subsequent fall could then drag the USD/JPY pair to the 144.00 mark and then to the 143.30 horizontal support.
Technical Levels: Supports and Resistances
USDJPY currently trading at 145.6 at the time of writing. Pair opened at 145.55 and is trading with a change of 0.03 % .
| Overview | Overview.1 | |
|---|---|---|
| 0 | Today last price | 145.60 |
| 1 | Today Daily Change | 0.05 |
| 2 | Today Daily Change % | 0.03 |
| 3 | Today daily open | 145.55 |
The pair remains strongly bullish on the daily timeframe. It trades above its 20 SMA @ 142.09, 50 SMA 141.82, 100 SMA @ 138.65 and 200 SMA @ 136.47.
| Trends | Trends.1 | |
|---|---|---|
| 0 | Daily SMA20 | 142.09 |
| 1 | Daily SMA50 | 141.82 |
| 2 | Daily SMA100 | 138.65 |
| 3 | Daily SMA200 | 136.47 |
The previous day high was 145.58 while the previous day low was 144.65. The daily 38.2% Fib levels comes at 145.23, expected to provide support. Similarly, the daily 61.8% fib level is at 145.01, expected to provide support.
Note the levels of interest below:
- Pivot support is noted at 144.94, 144.33, 144.02
- Pivot resistance is noted at 145.87, 146.19, 146.8
| Levels | Levels.1 |
|---|---|
| Previous Daily High | 145.58 |
| Previous Daily Low | 144.65 |
| Previous Weekly High | 145.00 |
| Previous Weekly Low | 141.51 |
| Previous Monthly High | 144.91 |
| Previous Monthly Low | 137.24 |
| Daily Fibonacci 38.2% | 145.23 |
| Daily Fibonacci 61.8% | 145.01 |
| Daily Pivot Point S1 | 144.94 |
| Daily Pivot Point S2 | 144.33 |
| Daily Pivot Point S3 | 144.02 |
| Daily Pivot Point R1 | 145.87 |
| Daily Pivot Point R2 | 146.19 |
| Daily Pivot Point R3 | 146.80 |
[/s2If]
Download Nehcap EAWe have two EAs that are operational on our LIVE accounts.
- EA-FIX: Check out the details here. Download EA-FIX . EA-FIX is a non-grid HFT scalper.
- EA-GROWTH: High quality low dd EA using trend grids. Download EA_GROWTHJoin Our Telegram Group
")


