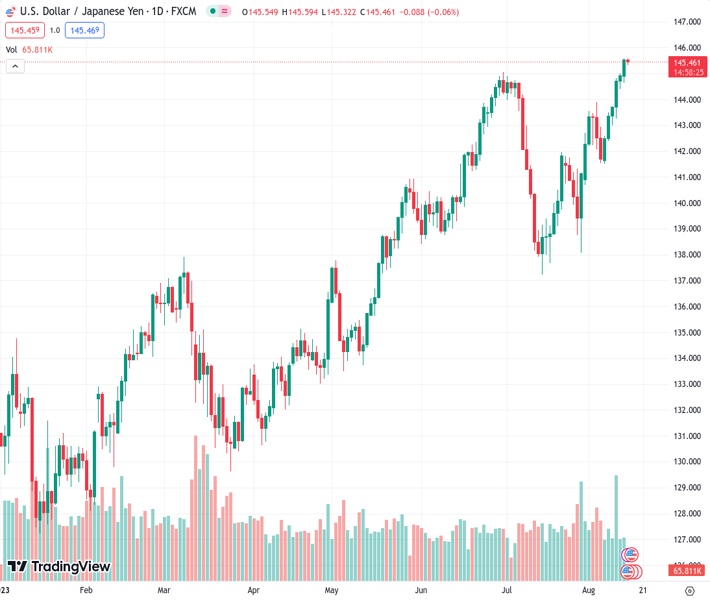
The USDJPY currency pair, currently at a rate of 145.463, has experienced its first daily decline in seven days. This decline comes as the currency pair starts to retreat from its year-to-date high and faces pressure near the lowest point reached during the day.
…
This is a premium post.
[s2If !current_user_can(access_s2member_level4)]Please register for FREE REGISTER to read full post below containing analysis. In case of any error or you think you are not able to read the full post below, please email us at support#nehcap.com [lwa][/s2If] [s2If current_user_can(access_s2member_level1)]
- USD/JPY prints the first daily loss in seven while reversing from YTD high, pressured around intraday low of late.
The pair currently trades last at 145.463.
The previous day high was 145.58 while the previous day low was 144.65. The daily 38.2% Fib levels comes at 145.23, expected to provide support. Similarly, the daily 61.8% fib level is at 145.01, expected to provide support.
USD/JPY clings to mild losses around 145.50-45 heading into Tuesday’s European session as it prints the first daily loss in seven. In doing so, the Yen pair takes clues from the upbeat Japanese statistics and the US Dollar’s retreat amid a sluggish Asian session.
That said, the Japanese economic growth came in as 1.5% QoQ versus 0.8% expected and 0.7% prior, per the preliminary readings of the second quarter (Q2) 2023 Gross Domestic Product (GDP) figures. Additionally, Japan’s Industrial Production also improves to 2.4% MoM in June versus 2.0% expected and prior.
Elsewhere, Japan’s Economy Minister Shigeyuki Goto cited expectations of witnessing a moderate economic recovery before suggesting the need to pay attention to the risk of global slowdown and the effects of price hikes.
It’s worth noting that the latest comments from Japanese Finance Minister Shunichi Suzuki also teased likely another intervention from Tokyo and exerted downside pressure on USD/JPY price. That said, the policymaker ruled out the possibility of targeting a specific price level when intervening while also showing dislike for rapid moves.
On the other hand, the US Dollar Index (DXY) retreats from the highest level in five weeks, printing the first daily loss in four around 103.05 by the press time, after witnessing downbeat inflation clues. That said, the New York Fed’s one-year inflation expectations eased to 3.5% for July, down three points by falling to the lowest level since April 2021. New York Fed survey, however, also suggested confidence in positive labor market conditions and economic transition.
Elsewhere, the US 10-year Treasury bond yields seesaw at the highest level since November 2022, marked the previous day, making rounds to 4.20% by the press time, which in turn also prods the USD/JPY buyers from extending the previous day’s run-up.
It should be observed that the market’s cautious optimism, as perceived from the mildly bid US and European stock futures, also poke the USD/JPY bulls.
Looking ahead, the US Retail Sales for July, expected 0.4% MoM versus 0.2% prior, will be important to watch for intermediate directions of the USD/JPY pair ahead of Wednesday’s Minutes of the Federal Reserve’s (Fed) latest monetary policy meeting. Above all, the bond market moves and the divergence between the Bank of Japan (BoJ) and the Fed will be crucial for a clear guide.
Overbought RSI conditions join an ascending resistance line from November 2022, close to 145.60 at the latest, to trigger the USD/JPY pair’s latest pullback. However, the Yen pair sellers need validation from a 12-day-old rising support line, close to 144.85 at the latest.
Technical Levels: Supports and Resistances
USDJPY currently trading at 145.47 at the time of writing. Pair opened at 145.55 and is trading with a change of -0.05% % .
| Overview | Overview.1 | |
|---|---|---|
| 0 | Today last price | 145.47 |
| 1 | Today Daily Change | -0.08 |
| 2 | Today Daily Change % | -0.05% |
| 3 | Today daily open | 145.55 |
The pair remains strongly bullish on the daily timeframe. It trades above its 20 SMA @ 142.09, 50 SMA 141.82, 100 SMA @ 138.65 and 200 SMA @ 136.47.
| Trends | Trends.1 | |
|---|---|---|
| 0 | Daily SMA20 | 142.09 |
| 1 | Daily SMA50 | 141.82 |
| 2 | Daily SMA100 | 138.65 |
| 3 | Daily SMA200 | 136.47 |
The previous day high was 145.58 while the previous day low was 144.65. The daily 38.2% Fib levels comes at 145.23, expected to provide support. Similarly, the daily 61.8% fib level is at 145.01, expected to provide support.
Note the levels of interest below:
- Pivot support is noted at 144.94, 144.33, 144.02
- Pivot resistance is noted at 145.87, 146.19, 146.8
| Levels | Levels.1 |
|---|---|
| Previous Daily High | 145.58 |
| Previous Daily Low | 144.65 |
| Previous Weekly High | 145.00 |
| Previous Weekly Low | 141.51 |
| Previous Monthly High | 144.91 |
| Previous Monthly Low | 137.24 |
| Daily Fibonacci 38.2% | 145.23 |
| Daily Fibonacci 61.8% | 145.01 |
| Daily Pivot Point S1 | 144.94 |
| Daily Pivot Point S2 | 144.33 |
| Daily Pivot Point S3 | 144.02 |
| Daily Pivot Point R1 | 145.87 |
| Daily Pivot Point R2 | 146.19 |
| Daily Pivot Point R3 | 146.80 |
[/s2If]
Download Nehcap EAWe have two EAs that are operational on our LIVE accounts.
- EA-FIX: Check out the details here. Download EA-FIX . EA-FIX is a non-grid HFT scalper.
- EA-GROWTH: High quality low dd EA using trend grids. Download EA_GROWTHJoin Our Telegram Group
")


