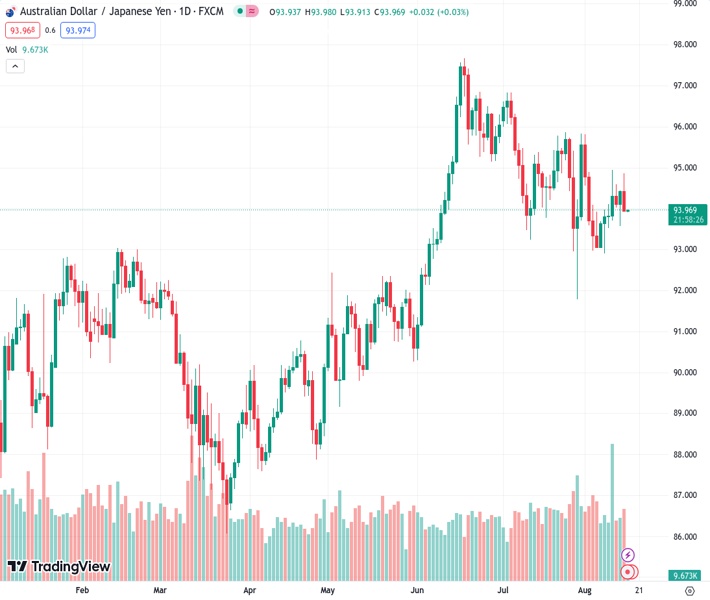
The AUDJPY pair is encountering obstacles from the Tenkan and Kijun-Sen lines at a rate of 93.9670, and is presently trading slightly higher at 93.93.
…
This is a premium post.
[s2If !current_user_can(access_s2member_level4)]Please register for FREE REGISTER to read full post below containing analysis. In case of any error or you think you are not able to read the full post below, please email us at support#nehcap.com [lwa][/s2If] [s2If current_user_can(access_s2member_level1)]
- AUD/JPY faces resistance from Tenkan and Kijun-Sen lines, currently trading just above at 93.93.
The pair currently trades last at 93.9670.
The previous day high was 94.44 while the previous day low was 93.58. The daily 38.2% Fib levels comes at 94.11, expected to provide resistance. Similarly, the daily 61.8% fib level is at 93.91, expected to provide support.
The AUD/JPY retraces from weekly highs reached during Tuesday’s session at around 94.86, prolonging its losses after cracking a five-month-old upslope support trendline that intersects with the 94.00 mark. At the time of writing, the AUD/JPY is trading at 93.93, down by a minimal 0.01%.
The daily chart portrays the AUD/JPY pair as subdued, capped on the downside by the Tenkan and Kijun-Sen lines at 93.92 and 93.82. If AUD/JPY slides past that area, the next support will emerge at the bottom of the Ichimoky Cloud (Kumo) at 93.45 before challenging 93.00.
Conversely, if AUD/JPY buyers reclaim the 94.00 figure, the first resistance would be the August 15 high of 94.86 ahead of testing the top of the Kumo at around 95.00/05. Once cleared, the next resistance would emerge at 95.83, the July 31 daily high.
Technical Levels: Supports and Resistances
AUDJPY currently trading at 93.94 at the time of writing. Pair opened at 94.42 and is trading with a change of -0.51 % .
| Overview | Overview.1 | |
|---|---|---|
| 0 | Today last price | 93.94 |
| 1 | Today Daily Change | -0.48 |
| 2 | Today Daily Change % | -0.51 |
| 3 | Today daily open | 94.42 |
The pair is trading below its 20 Daily moving average @ 94.38, below its 50 Daily moving average @ 94.97 , above its 100 Daily moving average @ 92.61 and above its 200 Daily moving average @ 91.91
| Trends | Trends.1 | |
|---|---|---|
| 0 | Daily SMA20 | 94.38 |
| 1 | Daily SMA50 | 94.97 |
| 2 | Daily SMA100 | 92.61 |
| 3 | Daily SMA200 | 91.91 |
The previous day high was 94.44 while the previous day low was 93.58. The daily 38.2% Fib levels comes at 94.11, expected to provide resistance. Similarly, the daily 61.8% fib level is at 93.91, expected to provide support.
Note the levels of interest below:
- Pivot support is noted at 93.85, 93.28, 92.98
- Pivot resistance is noted at 94.72, 95.02, 95.59
| Levels | Levels.1 |
|---|---|
| Previous Daily High | 94.44 |
| Previous Daily Low | 93.58 |
| Previous Weekly High | 94.94 |
| Previous Weekly Low | 92.90 |
| Previous Monthly High | 96.84 |
| Previous Monthly Low | 91.79 |
| Daily Fibonacci 38.2% | 94.11 |
| Daily Fibonacci 61.8% | 93.91 |
| Daily Pivot Point S1 | 93.85 |
| Daily Pivot Point S2 | 93.28 |
| Daily Pivot Point S3 | 92.98 |
| Daily Pivot Point R1 | 94.72 |
| Daily Pivot Point R2 | 95.02 |
| Daily Pivot Point R3 | 95.59 |
[/s2If]
Download Nehcap EAWe have two EAs that are operational on our LIVE accounts.
- EA-FIX: Check out the details here. Download EA-FIX . EA-FIX is a non-grid HFT scalper.
- EA-GROWTH: High quality low dd EA using trend grids. Download EA_GROWTHJoin Our Telegram Group
")


