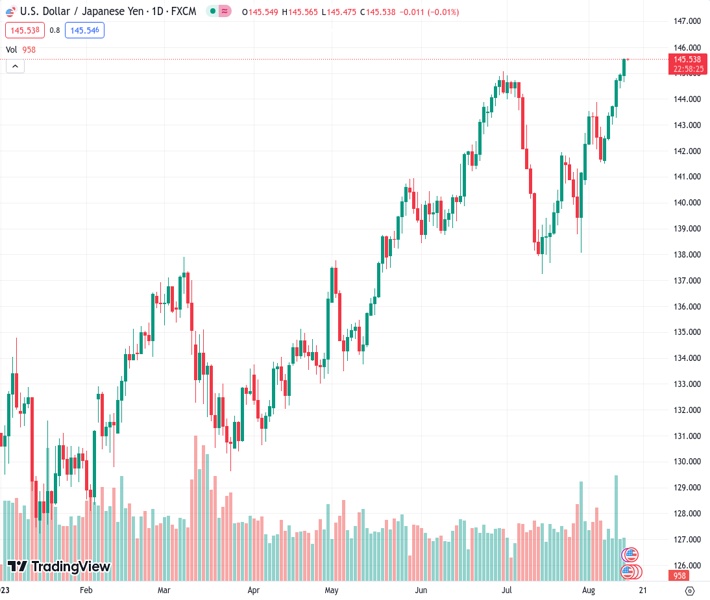
USDJPY successfully surpassed the resistance level at 145.00 and climbed to approximately 145.55, marking a continuous winning streak over the course of six days.
…
This is a premium post.
[s2If !current_user_can(access_s2member_level4)]Please register for FREE REGISTER to read full post below containing analysis. In case of any error or you think you are not able to read the full post below, please email us at support#nehcap.com [lwa][/s2If] [s2If current_user_can(access_s2member_level1)]
- USD/JPY finally broke with the 145.00 resistance and rose near 145.55, tallying a six-day winning streak.
The pair currently trades last at 145.544.
The previous day high was 145.0 while the previous day low was 144.42. The daily 38.2% Fib levels comes at 144.78, expected to provide support. Similarly, the daily 61.8% fib level is at 144.64, expected to provide support.
At the start of the week, the USD/JPY rose to its highest level since November 10, 2022, mainly driven by a cautious market mood and a stronger USD. In addition, after jumping above the key resistance of 145.00, there are no signs of the Bank of Japan (BoJ) of a stealth intervention which leaves the JPY vulnerable.
On the Japanese side, Tuesday will witness the release of the Q2 Gross Domestic Product (GDP) preliminary report, with projections anticipating a rise at a yearly rate of 3.1%. Nonetheless, it’s worth noting that the Bank of Japan (BoJ) has yet to show any indications of pivoting away from its accommodative monetary approach or engaging in market interference to manage the depreciation of the JPY. This lack of action could fuel an avenue for additional negative movement for the pair. However, if the Japanese economy shows signs of recovery, the BoJ might consider a pivot in its policies which could limit the Yen’s losses.
On the US side, Retail Sales from July will be released on Tuesday and are expected to have expanded at a monthly pace of 0.4% from its previous figure of 0.2%. In addition, the Federal Open Market Committee (FOMC) minutes from the last July’s meeting will be closely watched by investors on Wednesday to continue placing their bets for the next Federal Reserve (Fed) decisions. As for now, according to the CME FedWatch tool, markets are confident that the Fed will skip in September while the odds of a 25 basis point (bps) hike in November rose near 40%.
The daily chart analysis indicates a bullish outlook for the USD/JPY in the short term. The Relative Strength Index (RSI) is above its midline in positive territory, with a positive slope, aligning with the positive signal from the Moving Average Convergence Divergence (MACD), displaying green bars, and reinforcing the strong bullish sentiment. Moreover, the pair is above the 20,100,200-day Simple Moving Averages (SMAs), implying that the bulls retain control on a broader scale.
In addition, a distinct bullish dominance over sellers is evident on the four-hour chart, with indicators displaying a strong buying momentum.
Support levels: 145.00, 144.70, 144.00.
Resistance levels: 145.70, 146.00, 146.50.
Technical Levels: Supports and Resistances
USDJPY currently trading at 145.55 at the time of writing. Pair opened at 144.96 and is trading with a change of 0.41 % .
| Overview | Overview.1 | |
|---|---|---|
| 0 | Today last price | 145.55 |
| 1 | Today Daily Change | 0.59 |
| 2 | Today Daily Change % | 0.41 |
| 3 | Today daily open | 144.96 |
The pair remains strongly bullish on the daily timeframe. It trades above its 20 SMA @ 141.75, 50 SMA 141.7, 100 SMA @ 138.51 and 200 SMA @ 136.48.
| Trends | Trends.1 | |
|---|---|---|
| 0 | Daily SMA20 | 141.75 |
| 1 | Daily SMA50 | 141.70 |
| 2 | Daily SMA100 | 138.51 |
| 3 | Daily SMA200 | 136.48 |
The previous day high was 145.0 while the previous day low was 144.42. The daily 38.2% Fib levels comes at 144.78, expected to provide support. Similarly, the daily 61.8% fib level is at 144.64, expected to provide support.
Note the levels of interest below:
- Pivot support is noted at 144.59, 144.21, 144.01
- Pivot resistance is noted at 145.17, 145.38, 145.75
| Levels | Levels.1 |
|---|---|
| Previous Daily High | 145.00 |
| Previous Daily Low | 144.42 |
| Previous Weekly High | 145.00 |
| Previous Weekly Low | 141.51 |
| Previous Monthly High | 144.91 |
| Previous Monthly Low | 137.24 |
| Daily Fibonacci 38.2% | 144.78 |
| Daily Fibonacci 61.8% | 144.64 |
| Daily Pivot Point S1 | 144.59 |
| Daily Pivot Point S2 | 144.21 |
| Daily Pivot Point S3 | 144.01 |
| Daily Pivot Point R1 | 145.17 |
| Daily Pivot Point R2 | 145.38 |
| Daily Pivot Point R3 | 145.75 |
[/s2If]
Download Nehcap EAWe have two EAs that are operational on our LIVE accounts.
- EA-FIX: Check out the details here. Download EA-FIX . EA-FIX is a non-grid HFT scalper.
- EA-GROWTH: High quality low dd EA using trend grids. Download EA_GROWTHJoin Our Telegram Group
")


