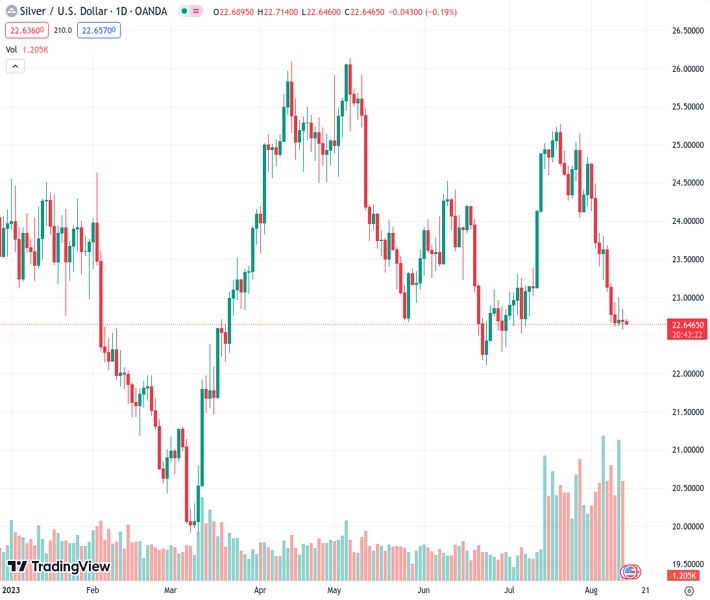
The price of silver at $22.645, under the symbol XAGUSD, is recovering after experiencing its biggest drop since mid-June. The viewpoint of @nehcap suggests that there is likely to be more decline in the future.
…
This is a premium post.
[s2If !current_user_can(access_s2member_level4)]Please register for FREE REGISTER to read full post below containing analysis. In case of any error or you think you are not able to read the full post below, please email us at support#nehcap.com [lwa][/s2If] [s2If current_user_can(access_s2member_level1)]
- Silver Price licks its wounds after falling the most since mid-June.
The pair currently trades last at 22.645.
The previous day high was 22.84 while the previous day low was 22.58. The daily 38.2% Fib levels comes at 22.68, expected to provide resistance. Similarly, the daily 61.8% fib level is at 22.74, expected to provide resistance.
Silver Price (XAG/USD) remains on the back foot at the lowest levels in five weeks despite portraying inaction at around $22.70 during early Monday in Asia. That said, the bright metal posted a four-week downtrend with the biggest weekly fall since June in the last.
It’s worth noting that the XAG/USD’s downside break of the 200-SMA and ascending trend line from late June previously pleased the bears.
However, the nearly oversold RSI (14) line and the bullish MACD signals seem to recently challenge the bullion’s further downside.
Even so, the Silver Price stays on the way to challenging the yearly low surrounding $19.90 with June’s bottom of around $22.10 and the $22.00 round figure acting as intermediate halts.
That said, a one-week-old descending resistance line near $22.90 precedes the $23.00 round figure to restrict the quote’s corrective bounce. Though, more importance will be given to a seven-week-old previous support line and the 200-SMA, respectively near $23.65 and $23.80, for luring the bulls.
Even if the quote rises past $23.80, the late July swing low of around $24.05 will act as the final defense of the XAG/USD bears.
To sum up, the Silver Price remains on the bear’s radar unless crossing $24.05 and hence the sellers can consider the latest corrective bounce as an opportunity for buying, considering the metal gains support from fundamentals.
Trend: Further downside expected
Technical Levels: Supports and Resistances
XAGUSD currently trading at 22.69 at the time of writing. Pair opened at 22.69 and is trading with a change of 0.00% % .
| Overview | Overview.1 | |
|---|---|---|
| 0 | Today last price | 22.69 |
| 1 | Today Daily Change | 0.00 |
| 2 | Today Daily Change % | 0.00% |
| 3 | Today daily open | 22.69 |
The pair remains strongly bearish on the daily time frame. It trades below the 20 SMA @ 24.04, 50 SMA 23.66, 100 SMA @ 24.05 and 200 SMA @ 23.26.
| Trends | Trends.1 | |
|---|---|---|
| 0 | Daily SMA20 | 24.04 |
| 1 | Daily SMA50 | 23.66 |
| 2 | Daily SMA100 | 24.05 |
| 3 | Daily SMA200 | 23.26 |
The previous day high was 22.84 while the previous day low was 22.58. The daily 38.2% Fib levels comes at 22.68, expected to provide resistance. Similarly, the daily 61.8% fib level is at 22.74, expected to provide resistance.
Note the levels of interest below:
- Pivot support is noted at 22.56, 22.43, 22.29
- Pivot resistance is noted at 22.83, 22.97, 23.1
| Levels | Levels.1 |
|---|---|
| Previous Daily High | 22.84 |
| Previous Daily Low | 22.58 |
| Previous Weekly High | 23.68 |
| Previous Weekly Low | 22.58 |
| Previous Monthly High | 25.27 |
| Previous Monthly Low | 22.52 |
| Daily Fibonacci 38.2% | 22.68 |
| Daily Fibonacci 61.8% | 22.74 |
| Daily Pivot Point S1 | 22.56 |
| Daily Pivot Point S2 | 22.43 |
| Daily Pivot Point S3 | 22.29 |
| Daily Pivot Point R1 | 22.83 |
| Daily Pivot Point R2 | 22.97 |
| Daily Pivot Point R3 | 23.10 |
[/s2If]
Download Nehcap EAWe have two EAs that are operational on our LIVE accounts.
- EA-FIX: Check out the details here. Download EA-FIX . EA-FIX is a non-grid HFT scalper.
- EA-GROWTH: High quality low dd EA using trend grids. Download EA_GROWTHJoin Our Telegram Group
")


