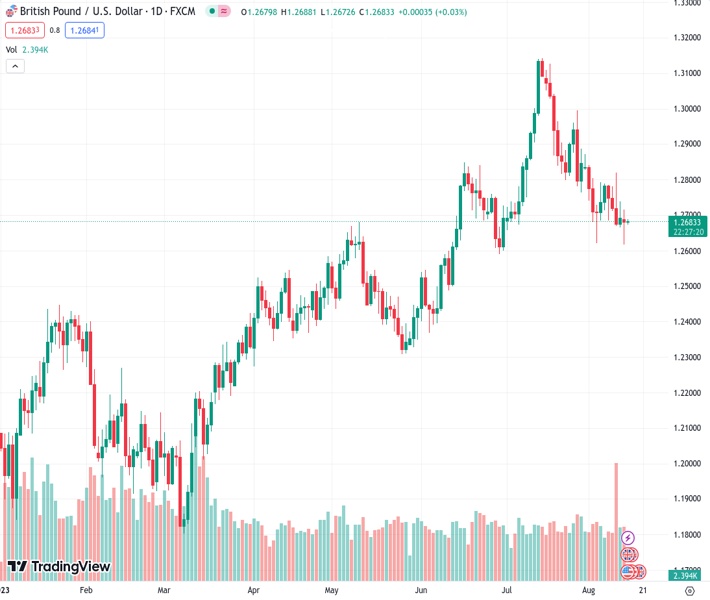
The GBPUSD pair is moving higher at the price of 1.26835 due to a small amount of positivity during the Asian trading session.
…
This is a premium post.
[s2If !current_user_can(access_s2member_level4)]Please register for FREE REGISTER to read full post below containing analysis. In case of any error or you think you are not able to read the full post below, please email us at support#nehcap.com [lwa][/s2If] [s2If current_user_can(access_s2member_level1)]
- GBP/USD edges north amid slight optimism in the Asian session.
The pair currently trades last at 1.26835.
The previous day high was 1.2739 while the previous day low was 1.2666. The daily 38.2% Fib levels comes at 1.2711, expected to provide resistance. Similarly, the daily 61.8% fib level is at 1.2694, expected to provide resistance.
GBP/USD aims upward for minimal gains of 0.02% as the Asian session begins, but still printing weekly losses following Monday’s session in which the GBP/USD lost 0.10% and reached a two-week low. At the time of writing, the GBP/USD exchanges hands at 1.2682.
From a technical perspective, the GBP/USD is neutral-upward biased, as the major dived towards the 100-day Exponential Moving Average (EMA) at 1.2609. Still, buyers entered the market, lifting the spot price to current levels. Notably, the GBP/USD is forming a ‘double bottom’ chart pattern that could pave the way for further gains, but first, the GBP/USD must reclaim resistance technical levels to confirm its validity.
The GBP/USD first resistance would be the 50-day EMA at 1.2733, followed by the 20-day EMA at 1.2761. Once those levels are surpassed, the GBP/USD next stop would be the August 10 high of 1.2819. If buyers push prices above those levels, the July 27 daily high at 1.2995 would be up for grabs.
On the other hand, if GBP/USD tumbled past the 100-day EMA at 1.2609, it would clear the way to challenge 1.2600 and the 200-day EMA at 1.2461.
Technical Levels: Supports and Resistances
GBPUSD currently trading at 1.2683 at the time of writing. Pair opened at 1.2696 and is trading with a change of -0.1 % .
| Overview | Overview.1 | |
|---|---|---|
| 0 | Today last price | 1.2683 |
| 1 | Today Daily Change | -0.0013 |
| 2 | Today Daily Change % | -0.1000 |
| 3 | Today daily open | 1.2696 |
The pair is trading below its 20 Daily moving average @ 1.2825, below its 50 Daily moving average @ 1.2764 , above its 100 Daily moving average @ 1.2609 and above its 200 Daily moving average @ 1.2351
| Trends | Trends.1 | |
|---|---|---|
| 0 | Daily SMA20 | 1.2825 |
| 1 | Daily SMA50 | 1.2764 |
| 2 | Daily SMA100 | 1.2609 |
| 3 | Daily SMA200 | 1.2351 |
The previous day high was 1.2739 while the previous day low was 1.2666. The daily 38.2% Fib levels comes at 1.2711, expected to provide resistance. Similarly, the daily 61.8% fib level is at 1.2694, expected to provide resistance.
Note the levels of interest below:
- Pivot support is noted at 1.2662, 1.2628, 1.2589
- Pivot resistance is noted at 1.2735, 1.2773, 1.2807
| Levels | Levels.1 |
|---|---|
| Previous Daily High | 1.2739 |
| Previous Daily Low | 1.2666 |
| Previous Weekly High | 1.2819 |
| Previous Weekly Low | 1.2666 |
| Previous Monthly High | 1.3142 |
| Previous Monthly Low | 1.2659 |
| Daily Fibonacci 38.2% | 1.2711 |
| Daily Fibonacci 61.8% | 1.2694 |
| Daily Pivot Point S1 | 1.2662 |
| Daily Pivot Point S2 | 1.2628 |
| Daily Pivot Point S3 | 1.2589 |
| Daily Pivot Point R1 | 1.2735 |
| Daily Pivot Point R2 | 1.2773 |
| Daily Pivot Point R3 | 1.2807 |
[/s2If]
Download Nehcap EAWe have two EAs that are operational on our LIVE accounts.
- EA-FIX: Check out the details here. Download EA-FIX . EA-FIX is a non-grid HFT scalper.
- EA-GROWTH: High quality low dd EA using trend grids. Download EA_GROWTHJoin Our Telegram Group
")


