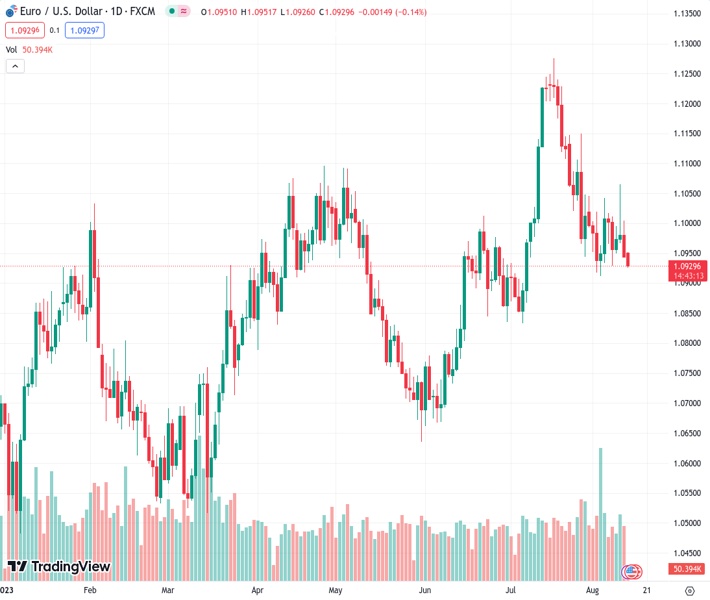
The EUR/USD currency pair, trading at 1.09291, is recovering from a decline and is currently at its lowest point in the past week.
…
This is a premium post.
[s2If !current_user_can(access_s2member_level4)]Please register for FREE REGISTER to read full post below containing analysis. In case of any error or you think you are not able to read the full post below, please email us at support#nehcap.com [lwa][/s2If] [s2If current_user_can(access_s2member_level1)]
- EUR/USD licks its wounds at the lowest level in a week.
The pair currently trades last at 1.09291.
The previous day high was 1.1005 while the previous day low was 1.0943. The daily 38.2% Fib levels comes at 1.0967, expected to provide resistance. Similarly, the daily 61.8% fib level is at 1.0981, expected to provide resistance.
EUR/USD remains pressured at the lowest level in a week, declining to 1.0925 amid early hours of Monday’s European session. In doing so, the Euro pair justifies the market’s rush towards the US Dollar despite the recently positive headlines from Italy.
Italian Prime Minister Giorgia Meloni ruled out further hardships for the banks after announcing a one off 40% windfall tax on them and taking full responsibility of the same. The same joins the US Dollar Index (DXY) retreat from the one-month high to prod the Euro bears.
However, fears of debt market fallouts in China and the looming recession woes in Eurozone exert downside pressure on the EUR/USD price, especially amid the firmer US Treasury bond yields.
Furthermore, the mixed readings of the German Wholesale Price Index (WPI) for July also favor the Euro pair sellers.
That said, a suspension of its bond trading by China’s Country Garden joins the non-receipt of the payments from a subsidiary of Chinese conglomerate Zhongzhi Enterprise Group to bolster the debt woes of China. Elsewhere, Russia’s readiness to equip new nuclear submarines with hypersonic missiles and the US-China trade war also contributes to the risk-off mood, which in turn weighs on the EUR /USD Price.
Elsewhere, the European Central Bank (ECB) officials have teased policy pivot in their latest public appearances while the ECB’s monthly economic outlook highlighted the macro uncertainty and keeps the Euro bears hopeful.
Amid these plays, the S&P500 and Euro Stoxx Futures remain mildly offered while the US 10-year Treasury bond yields grind higher 4.17%.
Looking ahead, light calendar in the bloc joins the cautious mood ahead of Fed Minutes to prod the EUR/USD pair traders. However, the risk-off mood may keep the sellers hopeful.
EUR/USD needs to provide a daily closing beneath the 100-DMA support of 1.0930 to aim for the 61.8% Fibonacci retracement of May-July upside, near 1.0880, as well as the previous monthly bottom surrounding 1.0835. Failing to do so can trigger the Euro pair’s corrective bounce toward the multi-day-old previous support line, close to 1.1040 at the latest.
Also read: EUR/USD Price Analysis: Euro bears approach 1.0900 as sour sentiment, firmer yields propel US Dollar
Technical Levels: Supports and Resistances
EURUSD currently trading at 1.0937 at the time of writing. Pair opened at 1.0946 and is trading with a change of -0.08% % .
| Overview | Overview.1 | |
|---|---|---|
| 0 | Today last price | 1.0937 |
| 1 | Today Daily Change | -0.0009 |
| 2 | Today Daily Change % | -0.08% |
| 3 | Today daily open | 1.0946 |
The pair is trading below its 20 Daily moving average @ 1.1043, below its 50 Daily moving average @ 1.0962 , above its 100 Daily moving average @ 1.0929 and above its 200 Daily moving average @ 1.0772
| Trends | Trends.1 | |
|---|---|---|
| 0 | Daily SMA20 | 1.1043 |
| 1 | Daily SMA50 | 1.0962 |
| 2 | Daily SMA100 | 1.0929 |
| 3 | Daily SMA200 | 1.0772 |
The previous day high was 1.1005 while the previous day low was 1.0943. The daily 38.2% Fib levels comes at 1.0967, expected to provide resistance. Similarly, the daily 61.8% fib level is at 1.0981, expected to provide resistance.
Note the levels of interest below:
- Pivot support is noted at 1.0924, 1.0903, 1.0862
- Pivot resistance is noted at 1.0986, 1.1027, 1.1049
| Levels | Levels.1 |
|---|---|
| Previous Daily High | 1.1005 |
| Previous Daily Low | 1.0943 |
| Previous Weekly High | 1.1065 |
| Previous Weekly Low | 1.0929 |
| Previous Monthly High | 1.1276 |
| Previous Monthly Low | 1.0834 |
| Daily Fibonacci 38.2% | 1.0967 |
| Daily Fibonacci 61.8% | 1.0981 |
| Daily Pivot Point S1 | 1.0924 |
| Daily Pivot Point S2 | 1.0903 |
| Daily Pivot Point S3 | 1.0862 |
| Daily Pivot Point R1 | 1.0986 |
| Daily Pivot Point R2 | 1.1027 |
| Daily Pivot Point R3 | 1.1049 |
[/s2If]
Download Nehcap EAWe have two EAs that are operational on our LIVE accounts.
- EA-FIX: Check out the details here. Download EA-FIX . EA-FIX is a non-grid HFT scalper.
- EA-GROWTH: High quality low dd EA using trend grids. Download EA_GROWTHJoin Our Telegram Group
")


