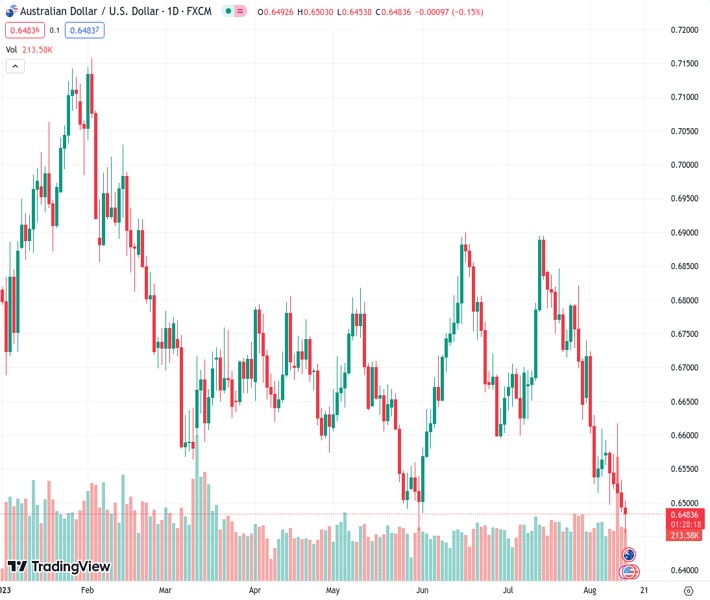
The AUDUSD currency pair experiences a small decline in value at a rate of 0.64838 due to increased demand for US bonds caused by the auction of US 3-month bills, resulting in a decrease in US Treasury yields.
…
This is a premium post.
[s2If !current_user_can(access_s2member_level4)]Please register for FREE REGISTER to read full post below containing analysis. In case of any error or you think you are not able to read the full post below, please email us at support#nehcap.com [lwa][/s2If] [s2If current_user_can(access_s2member_level1)]
- AUD/USD dips slightly as US 3-month bill auction boosts demand for US bonds, impacting UST yields.
The pair currently trades last at 0.64838.
The previous day high was 0.6534 while the previous day low was 0.6486. The daily 38.2% Fib levels comes at 0.6504, expected to provide resistance. Similarly, the daily 61.8% fib level is at 0.6515, expected to provide resistance.
AUD/USD pares some of its earlier losses as US Treasury bond yields turned flat after registering solid gains, but a US 3-month bills auction increased demand for US bonds, a headwind for UST yields. Consequently, the US Dollar (USD) trimmed some of its gains, and the AUD/USD exchanged hands at 0.6487, down 0.08%.
Investors’ sentiment improved late in the New York session, but the Greenback remains in the driver’s seat in the FX space, a headwind for the Australian Dollar (AUD). US T-bond yields extend their gains, with the most sensitive to interest rate shifts, the 2-year gaining seven basis points at 4.960%. Echoing its tone, the 10-year benchmark note rate is 4.187%, climbing three basis points, a tailwind for the US Dollar.
China’s real estate jitters involving its largest private developer Country Garden, reignited worries on its property market, as the company failed to pay bond interest last week, as happened to Evergrande in 2021.
In the meantime, Tuesday’s Asian session will feature the release of the Reserve Bank of Australia’s (RBA) last meeting minutes, with no surprises expected after the RBA’s decided to hold rates at 4.10%. After that, the Wage Price Index is estimated to stay at 3.7%, though any upticks could be seen as inflation gathering momentum, triggering further action by the central bank. It should be noted that the RBA’s Governor Philip Lowe’s latest appearance was dovish as he said, “Policymakers were in the “calibration stage,” as rates are already restrictive and working to establish a balance between supply and demand.”
On the US front, the agenda would be busy during the week, with Retail Sales and Industrial Production, are expected to improve, which could be bullish for the US Dollar (USD). In addition, the latest meeting Federal Open Market Committee (FOMC) minutes could give some clues, on the Federal Reserve’s (Fed) forward path, regarding monetary policy.
On the USD bearish side, a deterioration of labor market data, namely Initial Jobless Claims, could reaffirm the market’s view the US Federal Reserve (Fed) is hiking rates. Minnesota’s Fed President Neil Kashkari is expected to cross wires twice on Tuesday.
Given that the central bank convergence and interest rate differential favors the Greenback, further AUD/USD is expected. Nevertheless, traders must stay tuned to the economic calendar. Hawkish surprises from the RBA could trigger a reaction in the AUD/USD pair.
The AUD/USD bias remains downwards, though a daily close below the May 31 daily low of 0.6458 is needed to pave the way for a dip to the November 10 swing low of 0.6386. A breach of the latter will expose the November 3 daily low of 0.6272. On the other hand, in the less likely scenario, the AUD/USD first resistance would be the 0.6500 psychological level, followed by June’s 29 low of 0.6595, before testing 0.6600.
Technical Levels: Supports and Resistances
AUDUSD currently trading at 0.6489 at the time of writing. Pair opened at 0.6496 and is trading with a change of -0.11 % .
| Overview | Overview.1 | |
|---|---|---|
| 0 | Today last price | 0.6489 |
| 1 | Today Daily Change | -0.0007 |
| 2 | Today Daily Change % | -0.1100 |
| 3 | Today daily open | 0.6496 |
The pair remains strongly bearish on the daily time frame. It trades below the 20 SMA @ 0.666, 50 SMA 0.67, 100 SMA @ 0.6682 and 200 SMA @ 0.6737.
| Trends | Trends.1 | |
|---|---|---|
| 0 | Daily SMA20 | 0.6660 |
| 1 | Daily SMA50 | 0.6700 |
| 2 | Daily SMA100 | 0.6682 |
| 3 | Daily SMA200 | 0.6737 |
The previous day high was 0.6534 while the previous day low was 0.6486. The daily 38.2% Fib levels comes at 0.6504, expected to provide resistance. Similarly, the daily 61.8% fib level is at 0.6515, expected to provide resistance.
Note the levels of interest below:
- Pivot support is noted at 0.6477, 0.6458, 0.643
- Pivot resistance is noted at 0.6525, 0.6553, 0.6572
| Levels | Levels.1 |
|---|---|
| Previous Daily High | 0.6534 |
| Previous Daily Low | 0.6486 |
| Previous Weekly High | 0.6617 |
| Previous Weekly Low | 0.6486 |
| Previous Monthly High | 0.6895 |
| Previous Monthly Low | 0.6599 |
| Daily Fibonacci 38.2% | 0.6504 |
| Daily Fibonacci 61.8% | 0.6515 |
| Daily Pivot Point S1 | 0.6477 |
| Daily Pivot Point S2 | 0.6458 |
| Daily Pivot Point S3 | 0.6430 |
| Daily Pivot Point R1 | 0.6525 |
| Daily Pivot Point R2 | 0.6553 |
| Daily Pivot Point R3 | 0.6572 |
[/s2If]
Download Nehcap EAWe have two EAs that are operational on our LIVE accounts.
- EA-FIX: Check out the details here. Download EA-FIX . EA-FIX is a non-grid HFT scalper.
- EA-GROWTH: High quality low dd EA using trend grids. Download EA_GROWTHJoin Our Telegram Group
")


