#AUDJPY is experiencing limited trading activity, with its movement hindered by the 94.50 level, which acts as the initial barrier.
…
This is a premium post.
[s2If !current_user_can(access_s2member_level4)]Please register for FREE REGISTER to read full post below containing analysis. In case of any error or you think you are not able to read the full post below, please email us at support#nehcap.com [lwa][/s2If] [s2If current_user_can(access_s2member_level1)]
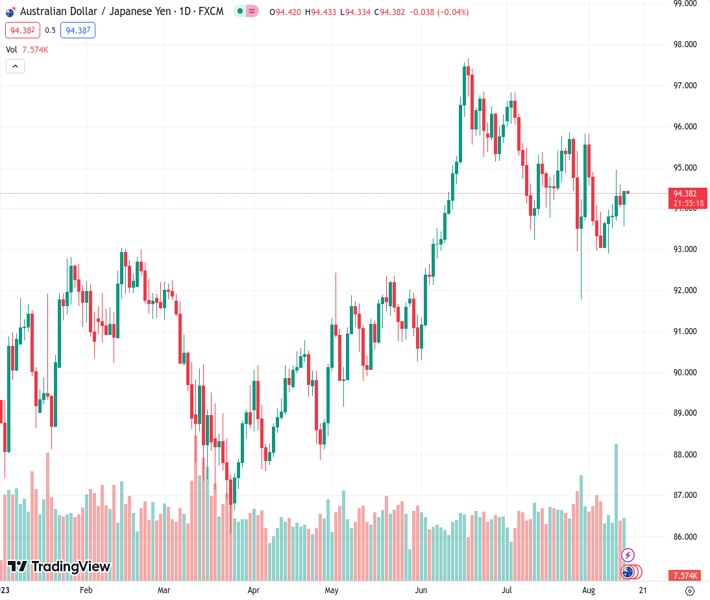
- AUD/JPY trades subdued, capped by the 94.50 figure as the first resistance level.
The pair currently trades last at 94.3950.
The previous day high was 94.59 while the previous day low was 94.02. The daily 38.2% Fib levels comes at 94.24, expected to provide support. Similarly, the daily 61.8% fib level is at 94.37, expected to provide support.
The AUD/JPY hovers around 94.40s, post-Monday’s positive session, with the cross-currency pair printing 0.33% gains, though the psychological 94.50 area capped the rally. At the time of writing, the AUD/JPY changes hands at 94.42, likely to remain sideways, as the pair stands inside the Ichimoky Cloud (Kumo).
From a technical standpoint, the AUD/JPY remains neutral-biased, though tilted downwards. On the upside, the AUD/JPY is capped by a two-month-old downslope resistance trendline at around 95.00. The next resistance would be the top of the Kumo at 95.20, which, once cleared, would expose the August 1 at 95.82 before testing 96.00.
On the flip side, the AUD/JPY first support would be followed by the 94.00 figure. The Tenkan-Sen is up next at 93.92, followed by the Senkou Span A at 93.87, ahead of the Kijun-Sen at 93.82.
Technical Levels: Supports and Resistances
AUDJPY currently trading at 94.4 at the time of writing. Pair opened at 94.17 and is trading with a change of 0.24 % .
| Overview | Overview.1 | |
|---|---|---|
| 0 | Today last price | 94.40 |
| 1 | Today Daily Change | 0.23 |
| 2 | Today Daily Change % | 0.24 |
| 3 | Today daily open | 94.17 |
The pair is trading above its 20 Daily moving average @ 94.39, below its 50 Daily moving average @ 94.93 , above its 100 Daily moving average @ 92.54 and above its 200 Daily moving average @ 91.91
| Trends | Trends.1 | |
|---|---|---|
| 0 | Daily SMA20 | 94.39 |
| 1 | Daily SMA50 | 94.93 |
| 2 | Daily SMA100 | 92.54 |
| 3 | Daily SMA200 | 91.91 |
The previous day high was 94.59 while the previous day low was 94.02. The daily 38.2% Fib levels comes at 94.24, expected to provide support. Similarly, the daily 61.8% fib level is at 94.37, expected to provide support.
Note the levels of interest below:
- Pivot support is noted at 93.93, 93.69, 93.36
- Pivot resistance is noted at 94.5, 94.83, 95.07
| Levels | Levels.1 |
|---|---|
| Previous Daily High | 94.59 |
| Previous Daily Low | 94.02 |
| Previous Weekly High | 94.94 |
| Previous Weekly Low | 92.90 |
| Previous Monthly High | 96.84 |
| Previous Monthly Low | 91.79 |
| Daily Fibonacci 38.2% | 94.24 |
| Daily Fibonacci 61.8% | 94.37 |
| Daily Pivot Point S1 | 93.93 |
| Daily Pivot Point S2 | 93.69 |
| Daily Pivot Point S3 | 93.36 |
| Daily Pivot Point R1 | 94.50 |
| Daily Pivot Point R2 | 94.83 |
| Daily Pivot Point R3 | 95.07 |
[/s2If]
Download Nehcap EAWe have two EAs that are operational on our LIVE accounts.
- EA-FIX: Check out the details here. Download EA-FIX . EA-FIX is a non-grid HFT scalper.
- EA-GROWTH: High quality low dd EA using trend grids. Download EA_GROWTHJoin Our Telegram Group
")


