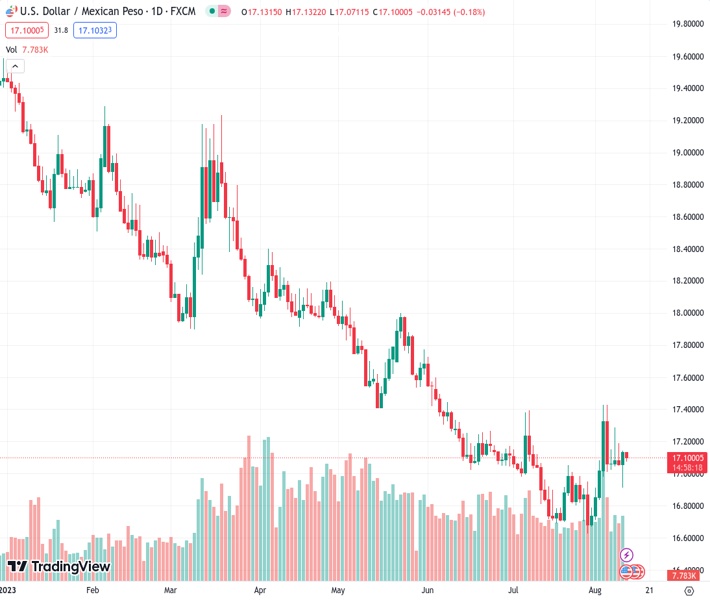
The USDMXN currency pair, which is currently at a rate of 17.1070, is pulling back after encountering resistance at an important exponential moving average (EMA) level. This has caused the pair to lose some of the gains it made the previous day when it bounced back from a low point it had reached in the past week. The viewpoint from @nehcap suggests that there is not much potential for further upward movement in the pair.
…
This is a premium post.
[s2If !current_user_can(access_s2member_level4)]Please register for FREE REGISTER to read full post below containing analysis. In case of any error or you think you are not able to read the full post below, please email us at support#nehcap.com [lwa][/s2If] [s2If current_user_can(access_s2member_level1)]
- USD/MXN retreats from key EMA hurdle, fades the previous day’s rebound from one-week low.
The pair currently trades last at 17.1070.
The previous day high was 17.1426 while the previous day low was 16.9101. The daily 38.2% Fib levels comes at 17.0538, expected to provide support. Similarly, the daily 61.8% fib level is at 16.9989, expected to provide support.
USD/MXN clings to mild losses near 17.11 heading into Friday’s European session as market players seek more clues to defend the previous day’s recovery from the weekly low. In doing so, the Mexican Peso (MXN) pair fades the currency’s fall past Banxico’s status quo amid fears of the Federal Reserve’s (Fed) policy pivot.
That said, the bullish MACD signals join the USD/MXN pair’s ability t stay beyond the 21-day Exponential Moving Average (EMA) and five-week-old horizontal support to keep the buyers hopeful to visit the area between 17.00 and 16.98.
Even so, the 50-EMA hurdle of 17.14 guards the immediate upside of the USD/MXN pair, a break of which could direct the Mexican Peso (MXN sellers toward the downward-sloping resistance line from early April, close to 17.28 at the latest.
It’s worth observing that the monthly high of nearly 17.42 acts as the final defense of the Mexican Peso buyers.
On the flip side, a clear break below the 16.98 support needs validation from the previous monthly low of around 16.62 to convince the USD/MXN bears.
Overall, USD/MXN remains on the bull’s radar despite the latest retreat.
Trend: Limited upside expected
Technical Levels: Supports and Resistances
USDMXN currently trading at 17.1102 at the time of writing. Pair opened at 17.1362 and is trading with a change of -0.15% % .
| Overview | Overview.1 | |
|---|---|---|
| 0 | Today last price | 17.1102 |
| 1 | Today Daily Change | -0.0260 |
| 2 | Today Daily Change % | -0.15% |
| 3 | Today daily open | 17.1362 |
The pair is trading above its 20 Daily moving average @ 16.922, above its 50 Daily moving average @ 17.0671 , below its 100 Daily moving average @ 17.4979 and below its 200 Daily moving average @ 18.2627
| Trends | Trends.1 | |
|---|---|---|
| 0 | Daily SMA20 | 16.9220 |
| 1 | Daily SMA50 | 17.0671 |
| 2 | Daily SMA100 | 17.4979 |
| 3 | Daily SMA200 | 18.2627 |
The previous day high was 17.1426 while the previous day low was 16.9101. The daily 38.2% Fib levels comes at 17.0538, expected to provide support. Similarly, the daily 61.8% fib level is at 16.9989, expected to provide support.
Note the levels of interest below:
- Pivot support is noted at 16.9834, 16.8305, 16.7509
- Pivot resistance is noted at 17.2158, 17.2954, 17.4482
| Levels | Levels.1 |
|---|---|
| Previous Daily High | 17.1426 |
| Previous Daily Low | 16.9101 |
| Previous Weekly High | 17.4274 |
| Previous Weekly Low | 16.6694 |
| Previous Monthly High | 17.3957 |
| Previous Monthly Low | 16.6258 |
| Daily Fibonacci 38.2% | 17.0538 |
| Daily Fibonacci 61.8% | 16.9989 |
| Daily Pivot Point S1 | 16.9834 |
| Daily Pivot Point S2 | 16.8305 |
| Daily Pivot Point S3 | 16.7509 |
| Daily Pivot Point R1 | 17.2158 |
| Daily Pivot Point R2 | 17.2954 |
| Daily Pivot Point R3 | 17.4482 |
[/s2If]
Download Nehcap EAWe have two EAs that are operational on our LIVE accounts.
- EA-FIX: Check out the details here. Download EA-FIX . EA-FIX is a non-grid HFT scalper.
- EA-GROWTH: High quality low dd EA using trend grids. Download EA_GROWTHJoin Our Telegram Group
")


