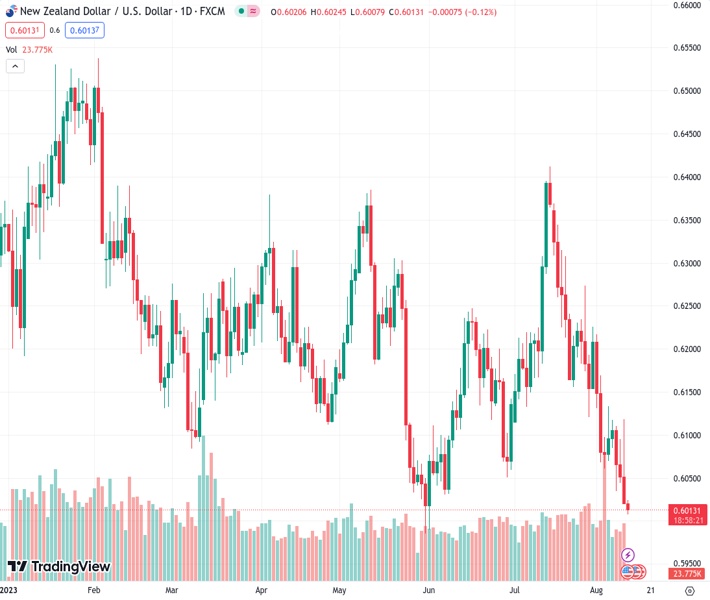
The NZDUSD currency pair, currently trading at 0.60146, is seeing increased buying activity as it seeks to reduce its losses for the week. The currency pair is currently at its lowest point in several days.
…
This is a premium post.
[s2If !current_user_can(access_s2member_level4)]Please register for FREE REGISTER to read full post below containing analysis. In case of any error or you think you are not able to read the full post below, please email us at support#nehcap.com [lwa][/s2If] [s2If current_user_can(access_s2member_level1)]
- NZD/USD picks up bids to pare weekly losses at multi-day low.
The pair currently trades last at 0.60146.
The previous day high was 0.6118 while the previous day low was 0.602. The daily 38.2% Fib levels comes at 0.6058, expected to provide resistance. Similarly, the daily 61.8% fib level is at 0.6081, expected to provide resistance.
NZD/USD remains indecisive after refreshing a 2.5-month low, fading bounce off the multiple days to near 0.6015 by the press time of early Friday in Auckland. In doing so, the Kiwi pair struggles to justify dovish bias about the Federal Reserve (Fed) amid concerns about witnessing the Reserve Bank of New Zealand’s (RBNZ) inaction.
The latest Reuters Poll on RBNZ suggests New Zealand’s central bank holding the benchmark interest rates unchanged on August 16, as well as extending the inaction towards at least end-March 2024.
On the same line were downbeat data from New Zealand (NZ) for July as the Business NZ PMI dropped to 46.3 versus 49.4 expected and 47.5 prior whereas the Food Price Index slid to -0.5% MoM for the said month versus 2.1% market forecasts and 1.6% marked in June.
Talking about the US data, the headline inflation figure Consumer Price Index (CPI) for July matched market forecasts to reprint 0.2% MoM figures. However, the yearly CPI improved slower-than-expected 3.3% to 3.2% YoY for the said month, versus 3.0% previous readings, marking the first acceleration in the annual rate in 13 months. Furthermore, the CPI ex Food & Energy, also known as the Core CPI, also flashed an unchanged 0.20% MoM figures while meeting market consensus but eased to 4.7% YoY compared to 4.8% marked in June and the expected numbers. It’s worth noting that the US Initial Jobless Claims rose to 248K for the week ended on August 04 versus 230K expected and 227K prior while Continuing Jobless Claims softened to 1.684M from 1.692M (revised), versus 1.71M market forecasts.
With the mostly downbeat US data, a slew of policymakers from the Federal Reserve (Fed) crossed wires while conveying the US central bank’s hard-earned victory on inflation. Even so, their tones appeared less convincing for doves and joined the risk-negative concerns about China to fuel the US Treasury bond yields.
That said, Philadelphia Federal Reserve Bank President Patrick Harker raised a toast to the Fed’s progress in its fight against inflation and was joined by Boston Federal Reserve President Susan Collins and Atlanta Federal Reserve Bank President Raphael Bostic to cheer the softer US CPI. However, San Francisco Fed President Daly turned down the cheers for their victory while saying, “There’s still more work to do.”
Elsewhere, the fears of witnessing more geopolitical tussles between the West and China, mainly due to the US restriction on investment in China technology companies and the likely repeat of the measures by the UK and European Union, weighed on the sentiment. Further, the chatters about slower economic growth in top-tier economies and recession woes in China, Germany and the UK pushed back the US Dollar bears as well. Additionally, the New Zealand Security Intelligence Service (NZSIS) said in the annual report that the nation is aware of intelligence activity linked to China in and against the island nation and the Pacific region, which in turn flagged geopolitical fears about the Kiwi nation and weighed on the New Zealand Dollar (NZD).
With this, the NZD/USD lacks recovery momentum despite the mildly bid S&P500 Futures and a retreat in the US Treasury bond yields, as well as the US Dollar.
Looking ahead, the US Producer Price Index (PPI) for July will precede the first readings of the University of Michigan’s (UoM) Consumer Sentiment Index (CSI) for August to direct immediate NZD/USD moves. Also important will be the UoM 5-Year Consumer Inflation Expectations for the said month. Above all, the next week’s RBNZ and China news will be crucial to determine the quote’s further direction.
Oversold RSI conditions join May’s low of 0.5985 to challenge NZD/USD bears. The pair’s recovery, however, needs validation from the monthly resistance line, around 0.6100 by the press time.
Technical Levels: Supports and Resistances
NZDUSD currently trading at 0.6019 at the time of writing. Pair opened at 0.6021 and is trading with a change of -0.03 % .
| Overview | Overview.1 | |
|---|---|---|
| 0 | Today last price | 0.6019 |
| 1 | Today Daily Change | -0.0002 |
| 2 | Today Daily Change % | -0.0300 |
| 3 | Today daily open | 0.6021 |
The pair remains strongly bearish on the daily time frame. It trades below the 20 SMA @ 0.6172, 50 SMA 0.6166, 100 SMA @ 0.6186 and 200 SMA @ 0.6233.
| Trends | Trends.1 | |
|---|---|---|
| 0 | Daily SMA20 | 0.6172 |
| 1 | Daily SMA50 | 0.6166 |
| 2 | Daily SMA100 | 0.6186 |
| 3 | Daily SMA200 | 0.6233 |
The previous day high was 0.6118 while the previous day low was 0.602. The daily 38.2% Fib levels comes at 0.6058, expected to provide resistance. Similarly, the daily 61.8% fib level is at 0.6081, expected to provide resistance.
Note the levels of interest below:
- Pivot support is noted at 0.5988, 0.5955, 0.589
- Pivot resistance is noted at 0.6086, 0.6152, 0.6185
| Levels | Levels.1 |
|---|---|
| Previous Daily High | 0.6118 |
| Previous Daily Low | 0.6020 |
| Previous Weekly High | 0.6226 |
| Previous Weekly Low | 0.6060 |
| Previous Monthly High | 0.6413 |
| Previous Monthly Low | 0.6120 |
| Daily Fibonacci 38.2% | 0.6058 |
| Daily Fibonacci 61.8% | 0.6081 |
| Daily Pivot Point S1 | 0.5988 |
| Daily Pivot Point S2 | 0.5955 |
| Daily Pivot Point S3 | 0.5890 |
| Daily Pivot Point R1 | 0.6086 |
| Daily Pivot Point R2 | 0.6152 |
| Daily Pivot Point R3 | 0.6185 |
[/s2If]
Download Nehcap EAWe have two EAs that are operational on our LIVE accounts.
- EA-FIX: Check out the details here. Download EA-FIX . EA-FIX is a non-grid HFT scalper.
- EA-GROWTH: High quality low dd EA using trend grids. Download EA_GROWTHJoin Our Telegram Group
")


