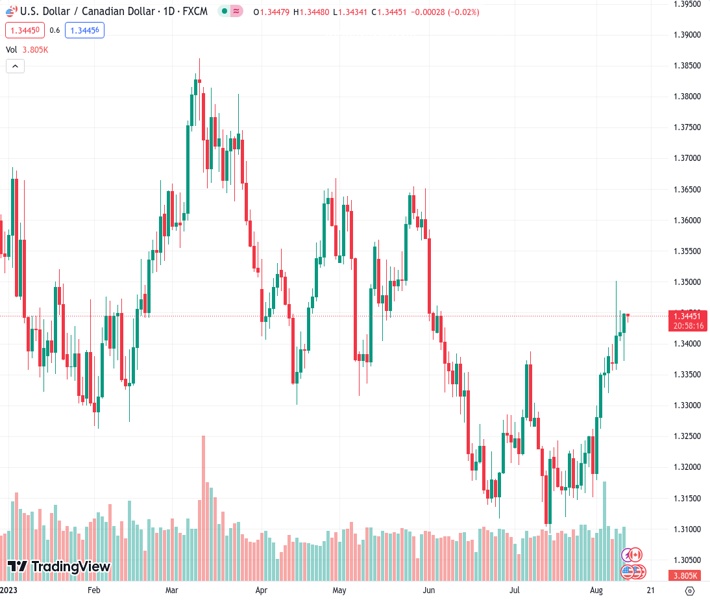
The exchange rate between the US dollar and Canadian dollar, currently at 1.34450, continues to stay within a small range below the 1.3450 level on Friday.
…
This is a premium post.
[s2If !current_user_can(access_s2member_level4)]Please register for FREE REGISTER to read full post below containing analysis. In case of any error or you think you are not able to read the full post below, please email us at support#nehcap.com [lwa][/s2If] [s2If current_user_can(access_s2member_level1)]
- USD/CAD remains confined in a narrow band below 1.3450 on Friday.
The pair currently trades last at 1.34450.
The previous day high was 1.3454 while the previous day low was 1.3404. The daily 38.2% Fib levels comes at 1.3435, expected to provide support. Similarly, the daily 61.8% fib level is at 1.3423, expected to provide support.
The USD/CAD pair consolidates its recent gains in the early Asian session on Friday. The major currently trades around 1.3445, losing 0.03% for the day. Market players await the US Producer Price Index (PPI) for some hints about further monetary policy in September’s Federal Reserve (Fed) meeting.
The strengthening of the US Dollar is bolstered by the odds of no additional rate hike this year and the hawkish comments from the Federal Reserve policymakers. The Fed San Francisco President, Mary C. Daly stated on Thursday that there is a lot more information to evaluate and it is premature to project whether additional rate increases or a prolonged period of holding rates are required. However, they are far from having a conversation about rate cuts. According to the CME FedWatch tool, markets are confident that the Fed won’t hike either in September or in November.
The US Bureau of Labor Statistics (BLS) reported on Thursday that the US Consumer Price Index (CPI) rose to 3.2% YoY from 3% in June. The figure was below the market consensus of 3.3%. On the same line, the Core CPI figure, which excludes volatile food and energy prices, fell to 4.7% from 4.8%. Additionally, the US Initial Jobless Claims increased to 248,000, above the expectation of 230,000.
On the other hand, Canadian Building Permits came in at 6.1% MoM in July, better than market expectations of a 3.5% drop. Additionally, Canada’s trade deficit widened to C$3.73 billion in June, the highest level in nearly three years. Exports fell 2.2%, and Imports fell 0.5%. Meanwhile, the downtick in oil prices weighs on the Loonie, as the country is the leading oil exporter to the United States.
Moving on, investors will keep an eye on the US Producer Price Index (PPI), due later in the day. The figure is expected to rise from 0.1% to 0.7% YoY. Also, the University of Michigan (UoM) Consumer Confidence Survey will be due in the American session. The data will be critical for determining a clear movement for the USD/CAD pair.
Technical Levels: Supports and Resistances
USDCAD currently trading at 1.3445 at the time of writing. Pair opened at 1.3419 and is trading with a change of 0.19 % .
| Overview | Overview.1 | |
|---|---|---|
| 0 | Today last price | 1.3445 |
| 1 | Today Daily Change | 0.0026 |
| 2 | Today Daily Change % | 0.1900 |
| 3 | Today daily open | 1.3419 |
The pair is trading above its 20 Daily moving average @ 1.3252, above its 50 Daily moving average @ 1.3268 , above its 100 Daily moving average @ 1.3393 and below its 200 Daily moving average @ 1.3452
| Trends | Trends.1 | |
|---|---|---|
| 0 | Daily SMA20 | 1.3252 |
| 1 | Daily SMA50 | 1.3268 |
| 2 | Daily SMA100 | 1.3393 |
| 3 | Daily SMA200 | 1.3452 |
The previous day high was 1.3454 while the previous day low was 1.3404. The daily 38.2% Fib levels comes at 1.3435, expected to provide support. Similarly, the daily 61.8% fib level is at 1.3423, expected to provide support.
Note the levels of interest below:
- Pivot support is noted at 1.3397, 1.3376, 1.3347
- Pivot resistance is noted at 1.3447, 1.3476, 1.3497
| Levels | Levels.1 |
|---|---|
| Previous Daily High | 1.3454 |
| Previous Daily Low | 1.3404 |
| Previous Weekly High | 1.3394 |
| Previous Weekly Low | 1.3151 |
| Previous Monthly High | 1.3387 |
| Previous Monthly Low | 1.3093 |
| Daily Fibonacci 38.2% | 1.3435 |
| Daily Fibonacci 61.8% | 1.3423 |
| Daily Pivot Point S1 | 1.3397 |
| Daily Pivot Point S2 | 1.3376 |
| Daily Pivot Point S3 | 1.3347 |
| Daily Pivot Point R1 | 1.3447 |
| Daily Pivot Point R2 | 1.3476 |
| Daily Pivot Point R3 | 1.3497 |
[/s2If]
Download Nehcap EAWe have two EAs that are operational on our LIVE accounts.
- EA-FIX: Check out the details here. Download EA-FIX . EA-FIX is a non-grid HFT scalper.
- EA-GROWTH: High quality low dd EA using trend grids. Download EA_GROWTHJoin Our Telegram Group
")


