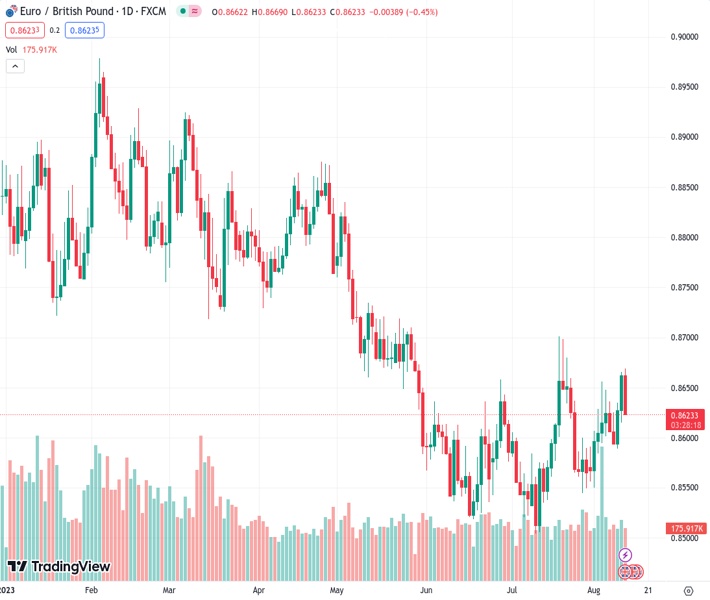
The EURGBP pair, currently at 0.86243, moved back towards the 0.8630 level after facing resistance at the 100-day simple moving average at 0.8670.
…
This is a premium post.
[s2If !current_user_can(access_s2member_level4)]Please register for FREE REGISTER to read full post below containing analysis. In case of any error or you think you are not able to read the full post below, please email us at support#nehcap.com [lwa][/s2If] [s2If current_user_can(access_s2member_level1)]
- EUR/GBP retreated near 0.8630 after being rejected by the 100-day SMA at 0.8670.
The pair currently trades last at 0.86243.
The previous day high was 0.8666 while the previous day low was 0.8625. The daily 38.2% Fib levels comes at 0.865, expected to provide resistance. Similarly, the daily 61.8% fib level is at 0.864, expected to provide resistance.
In Friday’s session, the GBP traded with gains agains most of its rivals as the UK reported strong Q2 economic activity figures, which faded recession fears. On the other hand, the EUR is trading mixed, while no relevant data was released during Friday’s session.
The UK’s second-quarter Gross Domestic Product (GDP) data revealed robust performance. In terms of the yearly measurement, it surged by 0.4%, surpassing both the anticipated and previous 0.2% figures. The quarter-on-quarter (QoQ) growth also stood at 0.2%, avoiding the predicted stagnation and beating the earlier 0.1% reading. In addition, Manufacturing and Industrial Production came in strong in June, seeing monthly increases of 2.4% and 1.8%, respectively, above expectations.
Reacting to the data, the British yields are seeing gains across the curve, making the GBP gain interest. The 10-year bond yield rose to 4.57% while the 2-year yield stands at 5.05% and the 5-year yielding 4.58%, respectively. In that sense, they reflect that markets expect the Bank of England (BoE) to continue hiking. According to the World Interest Rate Possibilities (WIRP) tool, investors are pricing 50 bps of additional tightening this cycle which would see the terminal rate peak at 5.75%.
According to the daily chart, the technical outlook for the EUR/GBP remains neutral to bearish as the bulls show signs of exhaustion and are losing traction. The Relative Strength Index (RSI) shows a weakening bullish trend with a negative slope above its midline, while the Moving Average Convergence (MACD) presents lower green bars. Furthermore, the pair is above the 20-day Simple Moving Average (SMA) but below the 100 and 200-day SMAs, indicating that the bulls aren’t done yet and have some gas left in the tank.
Support levels: 0.8615, 0.8600 (20-day SMA), 0.8570.
Resistance levels: 0.8670 (100-day SMA), 0.8700, 0.8723 (200-day SMA).
Technical Levels: Supports and Resistances
EURGBP currently trading at 0.8626 at the time of writing. Pair opened at 0.8663 and is trading with a change of -0.43 % .
| Overview | Overview.1 | |
|---|---|---|
| 0 | Today last price | 0.8626 |
| 1 | Today Daily Change | -0.0037 |
| 2 | Today Daily Change % | -0.4300 |
| 3 | Today daily open | 0.8663 |
The pair is trading above its 20 Daily moving average @ 0.8609, above its 50 Daily moving average @ 0.8587 , below its 100 Daily moving average @ 0.8671 and below its 200 Daily moving average @ 0.8725
| Trends | Trends.1 | |
|---|---|---|
| 0 | Daily SMA20 | 0.8609 |
| 1 | Daily SMA50 | 0.8587 |
| 2 | Daily SMA100 | 0.8671 |
| 3 | Daily SMA200 | 0.8725 |
The previous day high was 0.8666 while the previous day low was 0.8625. The daily 38.2% Fib levels comes at 0.865, expected to provide resistance. Similarly, the daily 61.8% fib level is at 0.864, expected to provide resistance.
Note the levels of interest below:
- Pivot support is noted at 0.8637, 0.861, 0.8596
- Pivot resistance is noted at 0.8678, 0.8692, 0.8719
| Levels | Levels.1 |
|---|---|
| Previous Daily High | 0.8666 |
| Previous Daily Low | 0.8625 |
| Previous Weekly High | 0.8656 |
| Previous Weekly Low | 0.8550 |
| Previous Monthly High | 0.8701 |
| Previous Monthly Low | 0.8504 |
| Daily Fibonacci 38.2% | 0.8650 |
| Daily Fibonacci 61.8% | 0.8640 |
| Daily Pivot Point S1 | 0.8637 |
| Daily Pivot Point S2 | 0.8610 |
| Daily Pivot Point S3 | 0.8596 |
| Daily Pivot Point R1 | 0.8678 |
| Daily Pivot Point R2 | 0.8692 |
| Daily Pivot Point R3 | 0.8719 |
[/s2If]
Download Nehcap EAWe have two EAs that are operational on our LIVE accounts.
- EA-FIX: Check out the details here. Download EA-FIX . EA-FIX is a non-grid HFT scalper.
- EA-GROWTH: High quality low dd EA using trend grids. Download EA_GROWTHJoin Our Telegram Group
")


