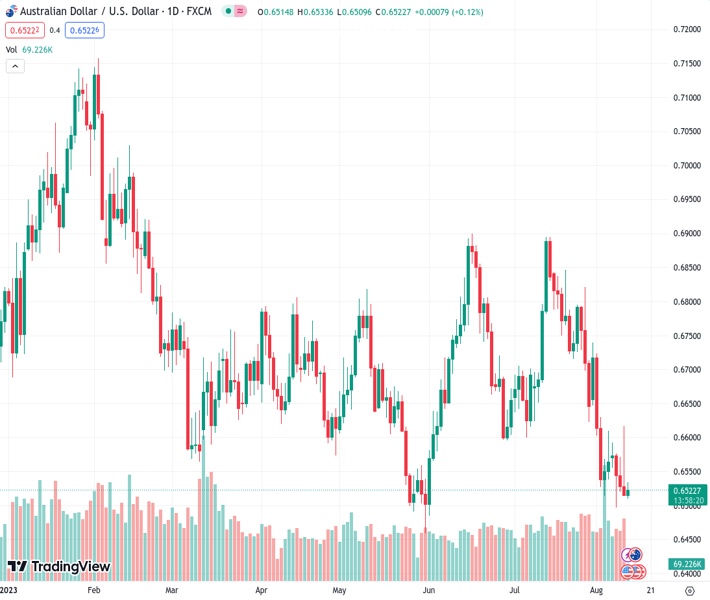
The AUDUSD currency pair, which is trading at a rate of 0.65221, has experienced its first daily increase in four days. It has maintained its recent small gains.
…
This is a premium post.
[s2If !current_user_can(access_s2member_level4)]Please register for FREE REGISTER to read full post below containing analysis. In case of any error or you think you are not able to read the full post below, please email us at support#nehcap.com [lwa][/s2If] [s2If current_user_can(access_s2member_level1)]
- AUD/USD prints the first daily gains in four, sticks to mild gains of late.
The pair currently trades last at 0.65221.
The previous day high was 0.6617 while the previous day low was 0.6514. The daily 38.2% Fib levels comes at 0.6553, expected to provide resistance. Similarly, the daily 61.8% fib level is at 0.6577, expected to provide resistance.
AUD/USD edges higher past 0.6500 during the first positive day in four, up 0.20% intraday near 0.6530 amid early Friday morning in Europe. In doing so, the Aussie pair justifies the recent hawkish bias about the Reserve Bank of Australia (RBA), as well as the hopes of the Federal Reserve’s (Fed) policy pivot, as market players brace for mid-tier US inflation clues. Also, the cautious optimism about China, Australia’s biggest customer, adds strength to the Aussie pair’s corrective bounce.
“It is possible that some further tightening of monetary policy will be required to ensure that inflation returns to target within a reasonable timeframe,” said RBA Governor Philip Lowe while speaking before the House of Representatives Standing Committee on Economics per Reuters. The policymaker also refrained from cheering the victory on inflation and defended the latest pause in the rate hike trajectory by stating that the successive rate lifts could result in higher unemployment.
On the other hand, unimpressive US inflation data allowed the Fed policymakers to cheer the victory over price pressure but the traders need more details to welcome the policy pivot concerns.
That said, the US Consumer Price Index (CPI) for July matched market forecasts to reprint 0.2% MoM figures. However, the yearly CPI improved slower-than-expected 3.3% to 3.2% YoY for the said month, versus 3.0% previous readings, marking the first acceleration in the annual rate in 13 months. Following the data, a slew of policymakers from the Federal Reserve (Fed) crossed wires while conveying the US central bank’s hard-earned victory on inflation. However, their tones appeared less convincing for doves and joined the risk-negative concerns about China to fuel the US Treasury bond yields afterward.
Elsewhere, China allows the provincial-level governments to raise about 1 trillion Yuan ($139 billion) via bond sales to repay the debt of local-government financing vehicles (LGFV) and other off-balance sheet issuers, per Bloomberg. The news justifies the market’s confidence in the Chinese policymakers’ capacity to avoid recession and weigh on the US Dollar, via a slightly positive market mood.
However, the fears of witnessing more geopolitical tussles between the West and China, mainly due to the US restriction on investment in China technology companies and the likely repeat of the measures by the UK and European Union, weighed on the sentiment and check the AUD/USD buyers. Furthermore, cautious mood ahead of the second-tier US inflation clues also prods the Aussie pair’s recovery moves after it reversed from a one-week high the previous day.
Among the key data, the US Producer Price Index (PPI) for July, the preliminary readings of the University of Michigan’s (UoM) Consumer Sentiment Index (CSI) for August and the UoM 5-Year Consumer Inflation Expectations for the said month will be important to watch for clear directions.
AUD/USD reverses the previous downside break of a 10-month-old rising trend line of around 0.6550. Also acting as a short-term downside filter is an upward-sloping trend line from November 2022, close to 0.6480 at the latest.
Technical Levels: Supports and Resistances
AUDUSD currently trading at 0.6528 at the time of writing. Pair opened at 0.6515 and is trading with a change of 0.20% % .
| Overview | Overview.1 | |
|---|---|---|
| 0 | Today last price | 0.6528 |
| 1 | Today Daily Change | 0.0013 |
| 2 | Today Daily Change % | 0.20% |
| 3 | Today daily open | 0.6515 |
The pair remains strongly bearish on the daily time frame. It trades below the 20 SMA @ 0.6677, 50 SMA 0.6702, 100 SMA @ 0.6683 and 200 SMA @ 0.6737.
| Trends | Trends.1 | |
|---|---|---|
| 0 | Daily SMA20 | 0.6677 |
| 1 | Daily SMA50 | 0.6702 |
| 2 | Daily SMA100 | 0.6683 |
| 3 | Daily SMA200 | 0.6737 |
The previous day high was 0.6617 while the previous day low was 0.6514. The daily 38.2% Fib levels comes at 0.6553, expected to provide resistance. Similarly, the daily 61.8% fib level is at 0.6577, expected to provide resistance.
Note the levels of interest below:
- Pivot support is noted at 0.6481, 0.6446, 0.6378
- Pivot resistance is noted at 0.6583, 0.6651, 0.6686
| Levels | Levels.1 |
|---|---|
| Previous Daily High | 0.6617 |
| Previous Daily Low | 0.6514 |
| Previous Weekly High | 0.6740 |
| Previous Weekly Low | 0.6514 |
| Previous Monthly High | 0.6895 |
| Previous Monthly Low | 0.6599 |
| Daily Fibonacci 38.2% | 0.6553 |
| Daily Fibonacci 61.8% | 0.6577 |
| Daily Pivot Point S1 | 0.6481 |
| Daily Pivot Point S2 | 0.6446 |
| Daily Pivot Point S3 | 0.6378 |
| Daily Pivot Point R1 | 0.6583 |
| Daily Pivot Point R2 | 0.6651 |
| Daily Pivot Point R3 | 0.6686 |
[/s2If]
Download Nehcap EAWe have two EAs that are operational on our LIVE accounts.
- EA-FIX: Check out the details here. Download EA-FIX . EA-FIX is a non-grid HFT scalper.
- EA-GROWTH: High quality low dd EA using trend grids. Download EA_GROWTHJoin Our Telegram Group
")


