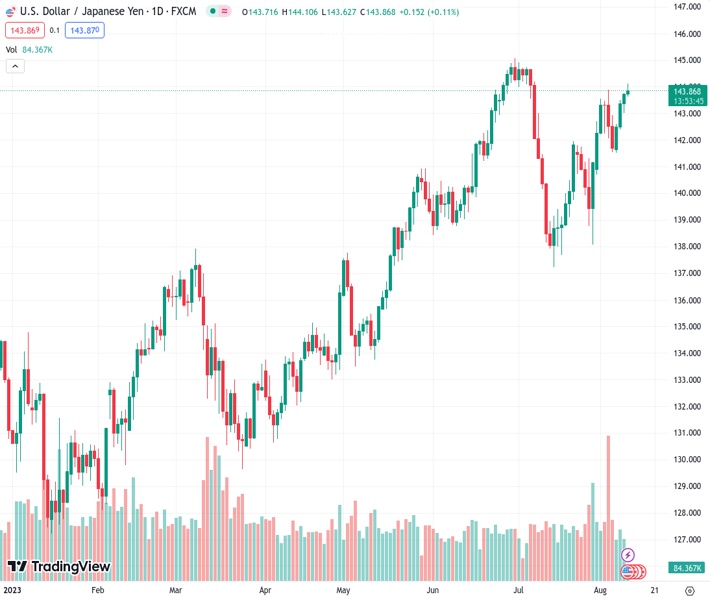
The USDJPY currency pair is experiencing a surge in momentum for the fourth day in a row, rallying towards the 144.00 level.
…
This is a premium post.
[s2If !current_user_can(access_s2member_level4)]Please register for FREE REGISTER to read full post below containing analysis. In case of any error or you think you are not able to read the full post below, please email us at support#nehcap.com [lwa][/s2If] [s2If current_user_can(access_s2member_level1)]
- USD/JPY gains momentum for the fourth consecutive day, just below the 144.00 barrier.
The pair currently trades last at 143.827.
The previous day high was 143.75 while the previous day low was 143.0. The daily 38.2% Fib levels comes at 143.46, expected to provide support. Similarly, the daily 61.8% fib level is at 143.29, expected to provide support.
The USD/JPY pair extends its upside for the fourth consecutive day, heading into an early European session on Thursday. The major pair currently trades around 143.95, gaining 0.15% for the day. Market participants await the US Consumer Price Index (CPI) for July for fresh impetus. The US inflation figure is expected to rise from 3% to 3.3%, and the core figure is expected to remain unchanged at 4.8%.
According to the four-hour chart, the USD/JPY pair stands above the 50- and 100-hour Exponential Moving Averages (EMAs) with an upward slope, which means the path of least resistance is to the upside for the major pair.
Any meaningful follow-through buying beyond 144.25 (the upper boundary of the Bollinger Band) could pave the way to the next hurdle at 144.65 (High July 6). The 144.90–145.00 zone will be a tough nut to crack for the USD/JPY pair. The mentioned level is the confluence of a high of June 30 and a psychological round mark.
On the downside, the immediate support level for USD/JPY is located at 143.10, representing the midline of the Bollinger Band en route to 142.65 (50-hour EMA). The additional downside filter is seen at 142.00 (100-hour EMA and the lower limit of the Bollinger Band), and finally at 141.50 (Low of August 7).
It’s worth noting that the Relative Strength Index (RSI) stands around 70 and Moving Average Convergence/Divergence (MACD) stays in bullish territory, which indicates that the upside momentum has been activated for the time being.
Technical Levels: Supports and Resistances
USDJPY currently trading at 143.95 at the time of writing. Pair opened at 143.73 and is trading with a change of 0.15 % .
| Overview | Overview.1 | |
|---|---|---|
| 0 | Today last price | 143.95 |
| 1 | Today Daily Change | 0.22 |
| 2 | Today Daily Change % | 0.15 |
| 3 | Today daily open | 143.73 |
The pair remains strongly bullish on the daily timeframe. It trades above its 20 SMA @ 141.1, 50 SMA 141.48, 100 SMA @ 138.23 and 200 SMA @ 136.5.
| Trends | Trends.1 | |
|---|---|---|
| 0 | Daily SMA20 | 141.10 |
| 1 | Daily SMA50 | 141.48 |
| 2 | Daily SMA100 | 138.23 |
| 3 | Daily SMA200 | 136.50 |
The previous day high was 143.75 while the previous day low was 143.0. The daily 38.2% Fib levels comes at 143.46, expected to provide support. Similarly, the daily 61.8% fib level is at 143.29, expected to provide support.
Note the levels of interest below:
- Pivot support is noted at 143.23, 142.74, 142.49
- Pivot resistance is noted at 143.98, 144.24, 144.73
| Levels | Levels.1 |
|---|---|
| Previous Daily High | 143.75 |
| Previous Daily Low | 143.00 |
| Previous Weekly High | 143.89 |
| Previous Weekly Low | 140.69 |
| Previous Monthly High | 144.91 |
| Previous Monthly Low | 137.24 |
| Daily Fibonacci 38.2% | 143.46 |
| Daily Fibonacci 61.8% | 143.29 |
| Daily Pivot Point S1 | 143.23 |
| Daily Pivot Point S2 | 142.74 |
| Daily Pivot Point S3 | 142.49 |
| Daily Pivot Point R1 | 143.98 |
| Daily Pivot Point R2 | 144.24 |
| Daily Pivot Point R3 | 144.73 |
[/s2If]
Download Nehcap EAWe have two EAs that are operational on our LIVE accounts.
- EA-FIX: Check out the details here. Download EA-FIX . EA-FIX is a non-grid HFT scalper.
- EA-GROWTH: High quality low dd EA using trend grids. Download EA_GROWTHJoin Our Telegram Group
")


