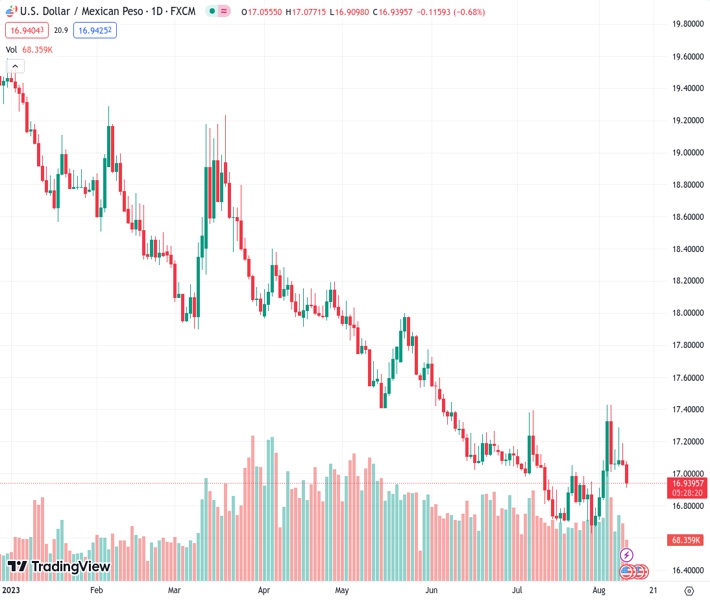
The US dollar to Mexican peso exchange rate dropped significantly to 16.9428 due to weak US Consumer Price Index data, which indicates that the Federal Reserve does not require any further interest rate hikes.
…
This is a premium post.
[s2If !current_user_can(access_s2member_level4)]Please register for FREE REGISTER to read full post below containing analysis. In case of any error or you think you are not able to read the full post below, please email us at support#nehcap.com [lwa][/s2If] [s2If current_user_can(access_s2member_level1)]
- Soft US CPI readings suggesting no more Fed hikes needed sent the USD/MXN plunging.
The pair currently trades last at 16.9428.
The previous day high was 17.1888 while the previous day low was 17.0488. The daily 38.2% Fib levels comes at 17.1023, expected to provide resistance. Similarly, the daily 61.8% fib level is at 17.1353, expected to provide resistance.
USD/MXN plummets below 17.0000 after the Department of Labor in the United States (US) revealed that inflation rose above the prior month’s data but below estimates, seen as a sign that the US Federal Reserve (Fed) tightening cycle has ended. Hence, the USD/MXN exchanges hands at 16.9280, losses 0.74%, ahead of the Bank of Mexico (Banxico) monetary policy decision.
The US Dollar (USD) cemented its faith in expectations for an inflation report that can spur speculations for further tightening by the Fed but failed to crystalize. The Consumer Price Index (CPI) rose 3.2% YoY, above June’s 3% but beneath forecasts, while core CPI, which strips volatile items, advanced 4.7% YoY, lower than the previous reading of 4.8% in June.
After the data, traders slashed bets the Fed would raise rates again, as shown by money market futures. The CME FedWatch Tools shows the chances for a rate hike in September below 10%, while for the November meeting, it dropped to 23.6% from 33.8% a month ago.
At the same time, another report from the Labor Department showed that Initial Jobless Claims for the week ending July 29 rose by 248K exceeding estimates of 230K.
Of late, the San Francisco Fed President Mary Daly stated that CPI data was good news. Still, the July report did not imply Fed’s victory n inflation, while stressing she’s data dependent and supported the last month’s Fed rate hike. She pushed back against easing monetary conditions, saying there’s a “long way from a conversation about rate cuts.”
Later in the day, Banxico is expected to hold rates unchanged at 11.25%, with traders eyeing signals about the forward path of the Mexican central bank. Dovish signs could weaken the Mexican Peso, and the USD/MXN could erase its earlier losses following US economic data releases.
With the USD/MXN breaking support at 17.0000, the pair is testing a previously broken resistance trendline that turned support, which is cushioning USD/MXN’s fall. The USD/MXN break below the 20-day Exponential Moving Average (EMA) at 16.9771 gave another leg-down to the pair. Nevertheless, traders should be aware that Banxico’s decision late in the day could trigger a fade move in the pair’s recent fall. Key support levels lie at a year-to-date (YTD) low of 16.6238, followed by the October 2015 swing low at 16.3267. Contrarily, USD/MXN’s resistance areas emerge at the 20-day EMA at 16.9771, followed by the 17.0000 psychological level and the 50-day EMA at 17.1222.
Technical Levels: Supports and Resistances
USDMXN currently trading at 16.9382 at the time of writing. Pair opened at 17.0603 and is trading with a change of -0.72 % .
| Overview | Overview.1 | |
|---|---|---|
| 0 | Today last price | 16.9382 |
| 1 | Today Daily Change | -0.1221 |
| 2 | Today Daily Change % | -0.7200 |
| 3 | Today daily open | 17.0603 |
The pair is trading above its 20 Daily moving average @ 16.9073, below its 50 Daily moving average @ 17.0754 , below its 100 Daily moving average @ 17.5123 and below its 200 Daily moving average @ 18.2753
| Trends | Trends.1 | |
|---|---|---|
| 0 | Daily SMA20 | 16.9073 |
| 1 | Daily SMA50 | 17.0754 |
| 2 | Daily SMA100 | 17.5123 |
| 3 | Daily SMA200 | 18.2753 |
The previous day high was 17.1888 while the previous day low was 17.0488. The daily 38.2% Fib levels comes at 17.1023, expected to provide resistance. Similarly, the daily 61.8% fib level is at 17.1353, expected to provide resistance.
Note the levels of interest below:
- Pivot support is noted at 17.0098, 16.9593, 16.8698
- Pivot resistance is noted at 17.1498, 17.2393, 17.2898
| Levels | Levels.1 |
|---|---|
| Previous Daily High | 17.1888 |
| Previous Daily Low | 17.0488 |
| Previous Weekly High | 17.4274 |
| Previous Weekly Low | 16.6694 |
| Previous Monthly High | 17.3957 |
| Previous Monthly Low | 16.6258 |
| Daily Fibonacci 38.2% | 17.1023 |
| Daily Fibonacci 61.8% | 17.1353 |
| Daily Pivot Point S1 | 17.0098 |
| Daily Pivot Point S2 | 16.9593 |
| Daily Pivot Point S3 | 16.8698 |
| Daily Pivot Point R1 | 17.1498 |
| Daily Pivot Point R2 | 17.2393 |
| Daily Pivot Point R3 | 17.2898 |
[/s2If]
Download Nehcap EAWe have two EAs that are operational on our LIVE accounts.
- EA-FIX: Check out the details here. Download EA-FIX . EA-FIX is a non-grid HFT scalper.
- EA-GROWTH: High quality low dd EA using trend grids. Download EA_GROWTHJoin Our Telegram Group
")


