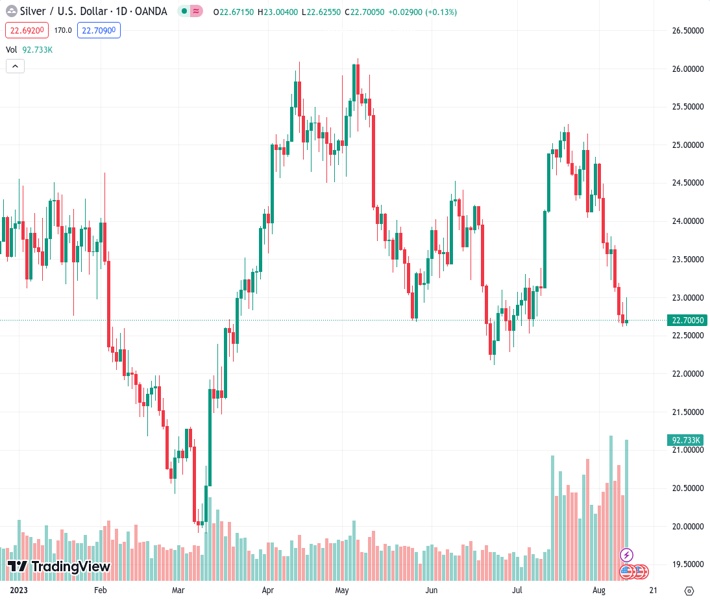
The price of XAGUSD at 22.600 had a partial recovery and increased beyond $22.50, reaching a peak around $23.00 for the day.
…
This is a premium post.
[s2If !current_user_can(access_s2member_level4)]Please register for FREE REGISTER to read full post below containing analysis. In case of any error or you think you are not able to read the full post below, please email us at support#nehcap.com [lwa][/s2If] [s2If current_user_can(access_s2member_level1)]
- XAG/USD recovered somewhat and rose above $22.50, hitting a daily high near $23.00.
The pair currently trades last at 22.600.
The previous day high was 22.94 while the previous day low was 22.62. The daily 38.2% Fib levels comes at 22.74, expected to provide resistance. Similarly, the daily 61.8% fib level is at 22.82, expected to provide resistance.
In Thursday’s session, the XAG/USD recovered ground but is limited by a resilient USD. In addition, American yields recovered from their initial backdown seen after the release of July’s inflation figures from the US and limited Silver’s advance.
According to the latest data from the US Bureau of Labor Statistics, the Consumer Price Index (CPI) for July demonstrated a month-on-month (MoM) increase of 0.2%, aligning with expectations. The annual gauge declined to 3.2% YoY, slightly below the anticipated 3.3%. Likewise, the Core CPI, which excludes volatile components, also saw a 0.2% increase for the same period as projected. On a yearly basis, the Core CPI measure registered a decrease of 4.7% YoY, coming in slightly lower than the expected 4.8%. Moreover, Jobless Claims, a weekly measure which tracks the number of people filling for unemployment benefits, picked up in the first week of August. The figure came in at 248,000, higher than the expected 230,000 and the last weekly figure of 227,000.
After seeing declines due to soft inflation data, US Treasury yields sharply rose in the middle of the American session, with the 2-year yield rising to 4.85% and the 5 and 10-year rates to 4.23% and 4.10%, limiting the grey metal’s advance.
Regarding the next Federal Reserve (Fed) decision, as for now and according to the CME FedWatch tool, markets continue to price low odds of a hike in September and Novemeber, but incoming data will be the ones which shape the expectations for the next Fed meetings. In that sense, monetary policy expectations will dictate the pace of the US bond markets and hence the short-term trajectory of the precious metals.
Analysing the daily chart, the XAG/USD technical outlook is bearish in the short term. The Relative Strength Index (RSI) is comfortably positioned below its midline in negative territory. It has a southward slope, indicating a favourable selling momentum. It is further supported by the negative signal from the Moving Average Convergence Divergence (MACD), displaying red bars, underscoring the growing bearish momentum. Additionally, the metal is below the 20,100,200-day Simple Moving Averages (SMAs), which suggests that the bears are in command of the broader picture.
Support levels: $22.50, $22.30, $22.00.
Resistance levels: $23.25 (200-day SMA), $23.50, $23.70, $24.00.
Technical Levels: Supports and Resistances
XAGUSD currently trading at 22.7 at the time of writing. Pair opened at 22.67 and is trading with a change of 0.13 % .
| Overview | Overview.1 | |
|---|---|---|
| 0 | Today last price | 22.70 |
| 1 | Today Daily Change | 0.03 |
| 2 | Today Daily Change % | 0.13 |
| 3 | Today daily open | 22.67 |
The pair remains strongly bearish on the daily time frame. It trades below the 20 SMA @ 24.26, 50 SMA 23.7, 100 SMA @ 24.06 and 200 SMA @ 23.22.
| Trends | Trends.1 | |
|---|---|---|
| 0 | Daily SMA20 | 24.26 |
| 1 | Daily SMA50 | 23.70 |
| 2 | Daily SMA100 | 24.06 |
| 3 | Daily SMA200 | 23.22 |
The previous day high was 22.94 while the previous day low was 22.62. The daily 38.2% Fib levels comes at 22.74, expected to provide resistance. Similarly, the daily 61.8% fib level is at 22.82, expected to provide resistance.
Note the levels of interest below:
- Pivot support is noted at 22.55, 22.43, 22.23
- Pivot resistance is noted at 22.86, 23.06, 23.18
| Levels | Levels.1 |
|---|---|
| Previous Daily High | 22.94 |
| Previous Daily Low | 22.62 |
| Previous Weekly High | 24.84 |
| Previous Weekly Low | 23.23 |
| Previous Monthly High | 25.27 |
| Previous Monthly Low | 22.52 |
| Daily Fibonacci 38.2% | 22.74 |
| Daily Fibonacci 61.8% | 22.82 |
| Daily Pivot Point S1 | 22.55 |
| Daily Pivot Point S2 | 22.43 |
| Daily Pivot Point S3 | 22.23 |
| Daily Pivot Point R1 | 22.86 |
| Daily Pivot Point R2 | 23.06 |
| Daily Pivot Point R3 | 23.18 |
[/s2If]
Download Nehcap EAWe have two EAs that are operational on our LIVE accounts.
- EA-FIX: Check out the details here. Download EA-FIX . EA-FIX is a non-grid HFT scalper.
- EA-GROWTH: High quality low dd EA using trend grids. Download EA_GROWTHJoin Our Telegram Group
")


