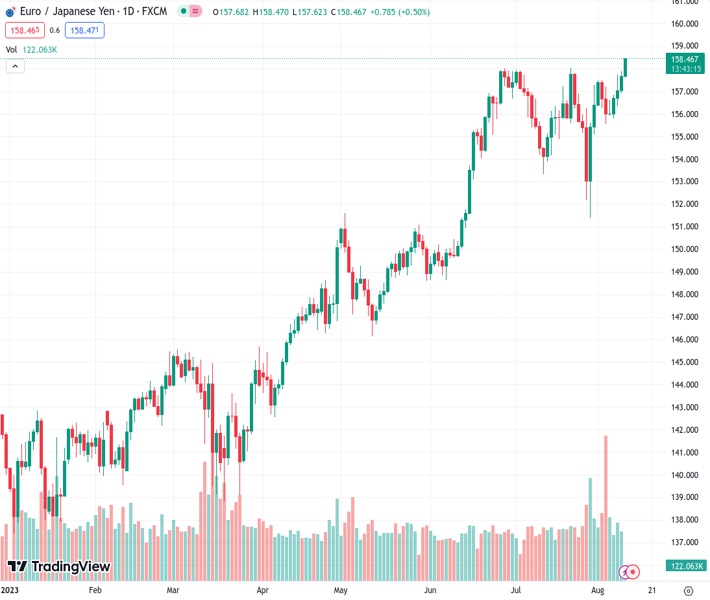
The EURJPY currency pair has reached its highest point since September 2008, standing at 158.455. The perspective from @nehcap suggests that there is potential for additional gains in the future.
…
This is a premium post.
[s2If !current_user_can(access_s2member_level4)]Please register for FREE REGISTER to read full post below containing analysis. In case of any error or you think you are not able to read the full post below, please email us at support#nehcap.com [lwa][/s2If] [s2If current_user_can(access_s2member_level1)]
- EUR/JPY marches to the highest level since September 2008.
The pair currently trades last at 158.455.
The previous day high was 157.9 while the previous day low was 156.91. The daily 38.2% Fib levels comes at 157.52, expected to provide support. Similarly, the daily 61.8% fib level is at 157.29, expected to provide support.
EUR/JPY refreshes multi-year high to 158.30 heading into Thursday’s European session after crossing the key upside hurdle earlier in the day. That said, the cross-currency pair’s run-up in the last four consecutive days also takes clues from the firmer MACD signals, as well as the upbeat but not overbought RSI (14) line.
With this, the quote is well set for reaching the 159.00 round figure ahead of poking the 160.00 psychological magnet.
However, the RSI may turn overbought around those levels and can challenge the EUR/JPY buyers.
Apart from that, the February 2007 peak of around 159.65 also acts as an extra filter towards the north.
Meanwhile, EUR/JPY pullback needs to provide a daily closing beneath the previous resistance line stretched from late June, close to 157.80 by the press time.
Following that, an ascending support line from late March, close to 156.60, and the 21-DMA level of 156.30 may prod the EUR/JPY bears.
Above all, the pair remains on the buyer’s radar unless breaking a three-month-old horizontal support zone surrounding 151.70-40.
To sum up, EUR/JPY pair’s upside break of 157.70 opened the door for the pair’s rally towards 160.00 but the futher advances appear doubtful.
Trend: Further upside expected
Technical Levels: Supports and Resistances
EURJPY currently trading at 158.27 at the time of writing. Pair opened at 157.75 and is trading with a change of 0.33% % .
| Overview | Overview.1 | |
|---|---|---|
| 0 | Today last price | 158.27 |
| 1 | Today Daily Change | 0.52 |
| 2 | Today Daily Change % | 0.33% |
| 3 | Today daily open | 157.75 |
The pair remains strongly bullish on the daily timeframe. It trades above its 20 SMA @ 156.18, 50 SMA 154.95, 100 SMA @ 151.02 and 200 SMA @ 146.88.
| Trends | Trends.1 | |
|---|---|---|
| 0 | Daily SMA20 | 156.18 |
| 1 | Daily SMA50 | 154.95 |
| 2 | Daily SMA100 | 151.02 |
| 3 | Daily SMA200 | 146.88 |
The previous day high was 157.9 while the previous day low was 156.91. The daily 38.2% Fib levels comes at 157.52, expected to provide support. Similarly, the daily 61.8% fib level is at 157.29, expected to provide support.
Note the levels of interest below:
- Pivot support is noted at 157.14, 156.54, 156.16
- Pivot resistance is noted at 158.13, 158.51, 159.12
| Levels | Levels.1 |
|---|---|
| Previous Daily High | 157.90 |
| Previous Daily Low | 156.91 |
| Previous Weekly High | 157.50 |
| Previous Weekly Low | 155.11 |
| Previous Monthly High | 158.05 |
| Previous Monthly Low | 151.41 |
| Daily Fibonacci 38.2% | 157.52 |
| Daily Fibonacci 61.8% | 157.29 |
| Daily Pivot Point S1 | 157.14 |
| Daily Pivot Point S2 | 156.54 |
| Daily Pivot Point S3 | 156.16 |
| Daily Pivot Point R1 | 158.13 |
| Daily Pivot Point R2 | 158.51 |
| Daily Pivot Point R3 | 159.12 |
[/s2If]
Download Nehcap EAWe have two EAs that are operational on our LIVE accounts.
- EA-FIX: Check out the details here. Download EA-FIX . EA-FIX is a non-grid HFT scalper.
- EA-GROWTH: High quality low dd EA using trend grids. Download EA_GROWTHJoin Our Telegram Group
")


