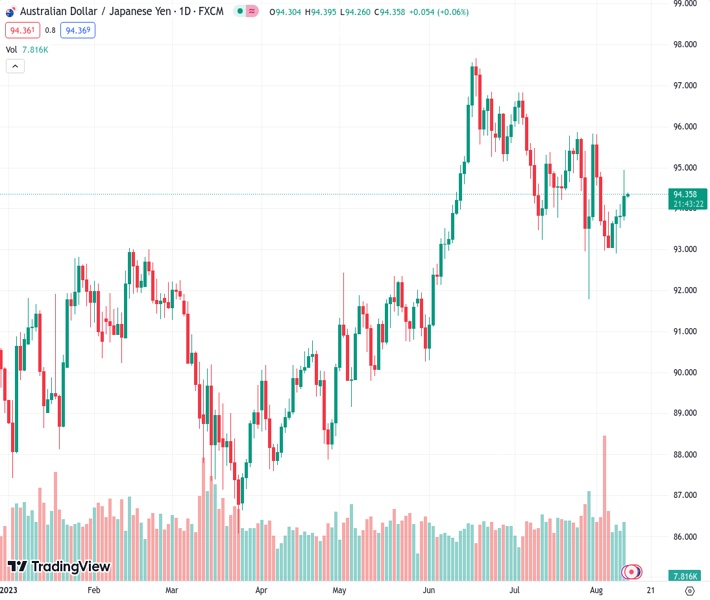
The AUDJPY currency pair reached a peak of 94.93, its highest level in a week, after being influenced by US inflation data that decreased the likelihood of a September interest rate hike by the Federal Reserve.
…
This is a premium post.
[s2If !current_user_can(access_s2member_level4)]Please register for FREE REGISTER to read full post below containing analysis. In case of any error or you think you are not able to read the full post below, please email us at support#nehcap.com [lwa][/s2If] [s2If current_user_can(access_s2member_level1)]
- AUD/JPY briefly touched one-week highs at 94.93, influenced by US inflation data which reduced chances for a Fed rate hike in September.
The pair currently trades last at 94.3100.
The previous day high was 94.11 while the previous day low was 93.53. The daily 38.2% Fib levels comes at 93.89, expected to provide support. Similarly, the daily 61.8% fib level is at 93.75, expected to provide support.
AUD/JPY climbs modestly as the Asian session begins, following Thursday’s session greatly influenced by the release of inflation data in the United States (US), cemented the case for the US Federal Reserve (Fed) to skip a rate hike in September. Although the AUD/JPY refreshed one-week highs at 94.93, it reversed its course and printed gains of 0.51%. The AUD/JPY exchanges hands at 94.38.
After struggling to break above 95.00 in Thursday’s session, the AUD/JPY is subject to weaken further, with sellers eyeing the lows of the Ichimoku Cloud (Kumo). Also, price action sliding below the Tenkan-Sen at 94.35 would likely keep the AUD/JPY trading within a familiar range inside the Kumo.
The AUD/JPY would resume bullish, with a decisive break of the 95.00 figure, which would lift prices above the Kumo, followed by a supply area within the 95.75/85 area.
Conversely, if AUD/JPY breaks below the Kijun-Sen, the first demand zone at 93.82, that would pave the way to test the August daily low of 92.89, followed by the bottom of the Kumo at 92.77.
Technical Levels: Supports and Resistances
AUDJPY currently trading at 94.38 at the time of writing. Pair opened at 93.83 and is trading with a change of 0.59 % .
| Overview | Overview.1 | |
|---|---|---|
| 0 | Today last price | 94.38 |
| 1 | Today Daily Change | 0.55 |
| 2 | Today Daily Change % | 0.59 |
| 3 | Today daily open | 93.83 |
The pair is trading below its 20 Daily moving average @ 94.46, below its 50 Daily moving average @ 94.83 , above its 100 Daily moving average @ 92.4 and above its 200 Daily moving average @ 91.91
| Trends | Trends.1 | |
|---|---|---|
| 0 | Daily SMA20 | 94.46 |
| 1 | Daily SMA50 | 94.83 |
| 2 | Daily SMA100 | 92.40 |
| 3 | Daily SMA200 | 91.91 |
The previous day high was 94.11 while the previous day low was 93.53. The daily 38.2% Fib levels comes at 93.89, expected to provide support. Similarly, the daily 61.8% fib level is at 93.75, expected to provide support.
Note the levels of interest below:
- Pivot support is noted at 93.53, 93.24, 92.95
- Pivot resistance is noted at 94.12, 94.41, 94.7
| Levels | Levels.1 |
|---|---|
| Previous Daily High | 94.11 |
| Previous Daily Low | 93.53 |
| Previous Weekly High | 95.83 |
| Previous Weekly Low | 92.97 |
| Previous Monthly High | 96.84 |
| Previous Monthly Low | 91.79 |
| Daily Fibonacci 38.2% | 93.89 |
| Daily Fibonacci 61.8% | 93.75 |
| Daily Pivot Point S1 | 93.53 |
| Daily Pivot Point S2 | 93.24 |
| Daily Pivot Point S3 | 92.95 |
| Daily Pivot Point R1 | 94.12 |
| Daily Pivot Point R2 | 94.41 |
| Daily Pivot Point R3 | 94.70 |
[/s2If]
Download Nehcap EAWe have two EAs that are operational on our LIVE accounts.
- EA-FIX: Check out the details here. Download EA-FIX . EA-FIX is a non-grid HFT scalper.
- EA-GROWTH: High quality low dd EA using trend grids. Download EA_GROWTHJoin Our Telegram Group
")


