Investors are waiting for US inflation data as the AUD/USD pair fluctuates around the 0.6560 level following a strong recovery.
…
This is a premium post.
[s2If !current_user_can(access_s2member_level4)]Please register for FREE REGISTER to read full post below containing analysis. In case of any error or you think you are not able to read the full post below, please email us at support#nehcap.com [lwa][/s2If] [s2If current_user_can(access_s2member_level1)]
- AUD/USD oscillates after a solid recovery around 0.6560 as investors await US inflation data.
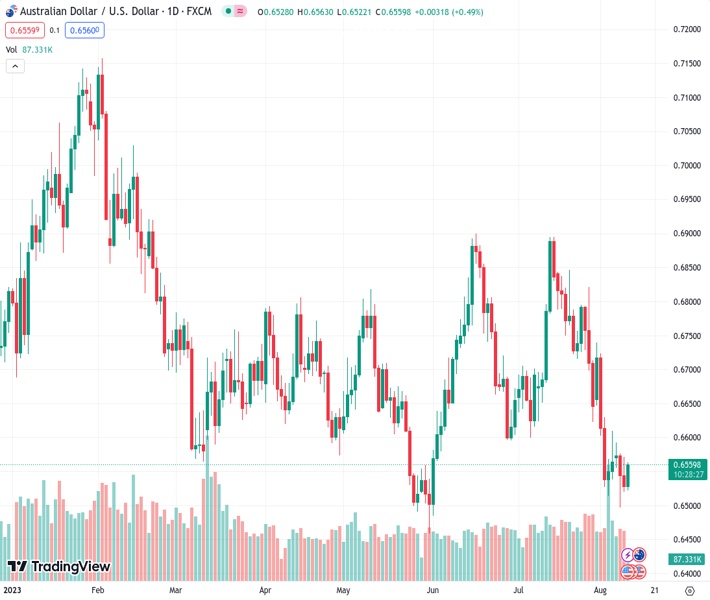
The pair currently trades last at 0.65602.
The previous day high was 0.6571 while the previous day low was 0.652. The daily 38.2% Fib levels comes at 0.654, expected to provide support. Similarly, the daily 61.8% fib level is at 0.6552, expected to provide support.
The AUD/USD pair consolidates around 0.6560 after rebounding from the psychological support of 0.6500 in the European session. The Aussie asset extended recovery but caution seems intact as the United States inflation data will be published at 12:30 GMT.
A sticky performance is expected from US Consumer Price Index (CPI) as gasoline prices rebounded modestly last month. This would propel chances of further policy-tightening by the Federal Reserve (Fed).
Meanwhile, expectations of fresh fiscal stimulus by the Chinese authority to stimulate economic demand provide support to the Australian Dollar. The Chinese economy falls into deflation due to bleak demand and falling exports, therefore fiscal and monetary stimulus seem warranted.
It is worth noting that Australia is the leading trading partner of China and fresh stimulus in China is supportive of the Australian Dollar.
AUD/USD rebounded strongly after the momentum oscillator, Relative Strength Index (RSI) (14) showed a weak impulse in the bearish trend. The Aussie asset climbs above the 50-period Exponential Moving Average (EMA) around 0.6545, which indicates that the mid-term trend turns bullish.
The RSI (14) climbs into the bullish range of 60.00-80.00, which indicates that an upside momentum triggers.
A decisive break above the horizontal resistance plotted from August 04 high around 0.6609 would break the series of lower highs and lower lows. This would drive the asset toward June 29 high at 0.6640, followed by the round-level resistance at 0.6700.
On the flip side, a breakdown below the psychological support of 0.6500 would expose the asset to May’s low around 0.6458. Breakdown of the latter would send the major to a fresh none-month low at 0.6414, which is 09 November 2022 low.
Technical Levels: Supports and Resistances
AUDUSD currently trading at 0.6559 at the time of writing. Pair opened at 0.6528 and is trading with a change of 0.47 % .
| Overview | Overview.1 | |
|---|---|---|
| 0 | Today last price | 0.6559 |
| 1 | Today Daily Change | 0.0031 |
| 2 | Today Daily Change % | 0.4700 |
| 3 | Today daily open | 0.6528 |
The pair remains strongly bearish on the daily time frame. It trades below the 20 SMA @ 0.6696, 50 SMA 0.6703, 100 SMA @ 0.6685 and 200 SMA @ 0.6736.
| Trends | Trends.1 | |
|---|---|---|
| 0 | Daily SMA20 | 0.6696 |
| 1 | Daily SMA50 | 0.6703 |
| 2 | Daily SMA100 | 0.6685 |
| 3 | Daily SMA200 | 0.6736 |
The previous day high was 0.6571 while the previous day low was 0.652. The daily 38.2% Fib levels comes at 0.654, expected to provide support. Similarly, the daily 61.8% fib level is at 0.6552, expected to provide support.
Note the levels of interest below:
- Pivot support is noted at 0.6508, 0.6488, 0.6457
- Pivot resistance is noted at 0.656, 0.6591, 0.6611
| Levels | Levels.1 |
|---|---|
| Previous Daily High | 0.6571 |
| Previous Daily Low | 0.6520 |
| Previous Weekly High | 0.6740 |
| Previous Weekly Low | 0.6514 |
| Previous Monthly High | 0.6895 |
| Previous Monthly Low | 0.6599 |
| Daily Fibonacci 38.2% | 0.6540 |
| Daily Fibonacci 61.8% | 0.6552 |
| Daily Pivot Point S1 | 0.6508 |
| Daily Pivot Point S2 | 0.6488 |
| Daily Pivot Point S3 | 0.6457 |
| Daily Pivot Point R1 | 0.6560 |
| Daily Pivot Point R2 | 0.6591 |
| Daily Pivot Point R3 | 0.6611 |
[/s2If]
Download Nehcap EAWe have two EAs that are operational on our LIVE accounts.
- EA-FIX: Check out the details here. Download EA-FIX . EA-FIX is a non-grid HFT scalper.
- EA-GROWTH: High quality low dd EA using trend grids. Download EA_GROWTHJoin Our Telegram Group
")


