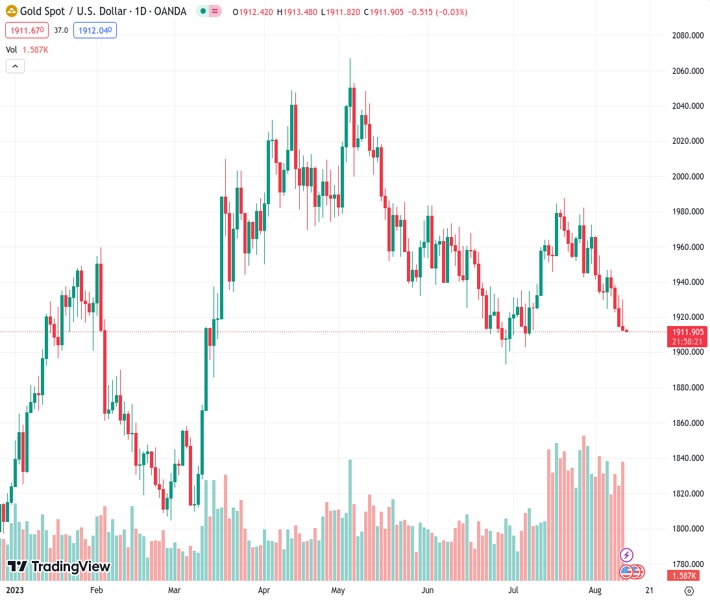
Gold prices remain under pressure at their lowest level in five weeks, following a volatile Thursday. According to @nehcap, it is anticipated that there will be further decline in the price.
…
This is a premium post.
[s2If !current_user_can(access_s2member_level4)]Please register for FREE REGISTER to read full post below containing analysis. In case of any error or you think you are not able to read the full post below, please email us at support#nehcap.com [lwa][/s2If] [s2If current_user_can(access_s2member_level1)]
- Gold Price remains pressured at the lowest level in five weeks after volatile Thursday.
The pair currently trades last at 1912.58.
The previous day high was 1932.43 while the previous day low was 1914.11. The daily 38.2% Fib levels comes at 1921.11, expected to provide resistance. Similarly, the daily 61.8% fib level is at 1925.43, expected to provide resistance.
Gold Price (XAU/USD) bears are in control at the lowest level in a month, despite the mid-Thursday’s corrective bounce, as markets await more clues of the US inflation data on early Friday. That said, the XAU/USD initially bounced off a one-month low after the United States inflation data flashed mixed signals and the Federal Reserve (Fed) officials cheered the victory against inflation. However, a jump in the US Treasury bond yield and looming China concerns favored the US Dollar’s recovery and drowned the Gold Price afterward.
Gold Price drops to the lowest level since early July, following an initial attempt to push back the bearish bias after the United States inflation data printed mixed signals and the Federal Reserve (Fed) officials were in a rush to cheer the victory against price pressure. However, strong US Treasury bond yields and fears emanating from China exert downside pressure on the XAU/USD price.
US Consumer Price Index (CPI) for July matched market forecasts to reprint 0.2% MoM figures. However, the yearly CPI improved slower-than-expected 3.3% to 3.2% YoY for the said month, versus 3.0% previous readings, marking the first acceleration in the annual rate in 13 months. Furthermore, the CPI ex Food & Energy, also known as the Core CPI, also flashed an unchanged 0.20% MoM figures while meeting market consensus but eased to 4.7% YoY compared to 4.8% marked in June and the expected numbers. Elsewhere, the US Initial Jobless Claims rose to 248K for the week ended on August 04 versus 230K expected and 227K prior while Continuing Jobless Claims softened to 1.684M from 1.692M (revised), versus 1.71M market forecasts.
The US statistics helped Philadelphia Federal Reserve Bank President Patrick Harker to toast the Fed’s progress in its fight against inflation and was joined by Boston Federal Reserve President Susan Collins and Atlanta Federal Reserve Bank President Raphael Bostic to cheer the softer US CPI. However, San Francisco Fed President Daly turned down the cheers for their victory while saying, “There’s still more work to do.”
Although the United States data and the Fed talks fuelled the market’s bets on the Federal Reserve’s (Fed) inaction for September, the traders were still concerned about the higher for longer rates in the US, as well as the geopolitical fears, which in turn favored the yields and the US Dollar while weighing on the Gold Price afterward.
It’s worth noting that growing fears that the UK and European Union will also follow the US in limiting investment in China technology companies seem to have challenged the market’s geopolitical concerns. Further, the chatters about slower economic growth in top-tier economies and recession woes in China, Germany and the UK pushed back the Gold buyers as well.
That said, the US Dollar Index (DXY) marked a positive daily closing around 102.62, after initially declining to the one-week low, whereas the US 10-year Treasury bond yields jumped the most in a week to 4.10% at the latest. Even so, Wall Street managed to end the day on a positive side, despite trimming gains by the day’s end.
While the aforementioned catalysts are likely to keep exerting downside pressure on the Gold Price, traders will be more concerned with additional clues for the US inflation to confirm the Fed’s victory against inflation and activate the XAU/USD rebound.
As a result, the US Producer Price Index (PPI) for July will precede the first readings of the University of Michigan’s (UoM) Consumer Sentiment Index (CSI) for August to direct intraday Gold Price moves. Also important will be the UoM 5-Year Consumer Inflation Expectations for the said month. Above all, the central bank updates and China news will be crucial to determine the pair’s further direction.
Gold Price justifies the downside break of the previous support line stretched from late November 2023 at a five-week low.
Adding credence to the downside bias are the bearish signals from the Moving Average Convergence and Divergence (MACD) indicator. However, the Relative Strength Index (RSI) line, placed at 14, remains below the 50.0 level and suggests bottom-picking of the XAU/USD.
With this, the convergence of the 200-DMA and 50% Fibonacci retracement of November 2022 to May 2023 upside, near the $1,900 round figure by the press time, becomes a tough nut to crack for the Gold sellers.
In a case where the XAU/USD remains bearish past $1,900, June’s low of $1,893 will act as the final defense of the buyers before directing the bullion toward the 61.8% Fibonacci retracement, also known as the golden Fibonacci ratio, of around $1,857.
On the contrary, the support-turned-resistance line stretched from late 2022, close to $1,940, closely followed by the 50-DMA level of around $1,943, guards the Gold Price recovery.
Following that, a three-month-old falling resistance line surrounding $1,955 and multiple tops marked since late May, near $1,985, will test the XAU/USD upside.
Overall, Gold Price is likely to remain bearish despite the latest corrective bounce.
Trend: Further downside expected
Technical Levels: Supports and Resistances
XAUUSD currently trading at 1912.97 at the time of writing. Pair opened at 1914.2 and is trading with a change of -0.06% % .
| Overview | Overview.1 | |
|---|---|---|
| 0 | Today last price | 1912.97 |
| 1 | Today Daily Change | -1.23 |
| 2 | Today Daily Change % | -0.06% |
| 3 | Today daily open | 1914.2 |
The pair is trading below its 20 Daily moving average @ 1952.6, below its 50 Daily moving average @ 1943.38 , below its 100 Daily moving average @ 1967.77 and above its 200 Daily moving average @ 1899.15
| Trends | Trends.1 | |
|---|---|---|
| 0 | Daily SMA20 | 1952.60 |
| 1 | Daily SMA50 | 1943.38 |
| 2 | Daily SMA100 | 1967.77 |
| 3 | Daily SMA200 | 1899.15 |
The previous day high was 1932.43 while the previous day low was 1914.11. The daily 38.2% Fib levels comes at 1921.11, expected to provide resistance. Similarly, the daily 61.8% fib level is at 1925.43, expected to provide resistance.
Note the levels of interest below:
- Pivot support is noted at 1908.06, 1901.93, 1889.74
- Pivot resistance is noted at 1926.38, 1938.57, 1944.7
| Levels | Levels.1 |
|---|---|
| Previous Daily High | 1932.43 |
| Previous Daily Low | 1914.11 |
| Previous Weekly High | 1972.45 |
| Previous Weekly Low | 1925.72 |
| Previous Monthly High | 1987.54 |
| Previous Monthly Low | 1902.77 |
| Daily Fibonacci 38.2% | 1921.11 |
| Daily Fibonacci 61.8% | 1925.43 |
| Daily Pivot Point S1 | 1908.06 |
| Daily Pivot Point S2 | 1901.93 |
| Daily Pivot Point S3 | 1889.74 |
| Daily Pivot Point R1 | 1926.38 |
| Daily Pivot Point R2 | 1938.57 |
| Daily Pivot Point R3 | 1944.70 |
[/s2If]
Download Nehcap EAWe have two EAs that are operational on our LIVE accounts.
- EA-FIX: Check out the details here. Download EA-FIX . EA-FIX is a non-grid HFT scalper.
- EA-GROWTH: High quality low dd EA using trend grids. Download EA_GROWTHJoin Our Telegram Group
")


