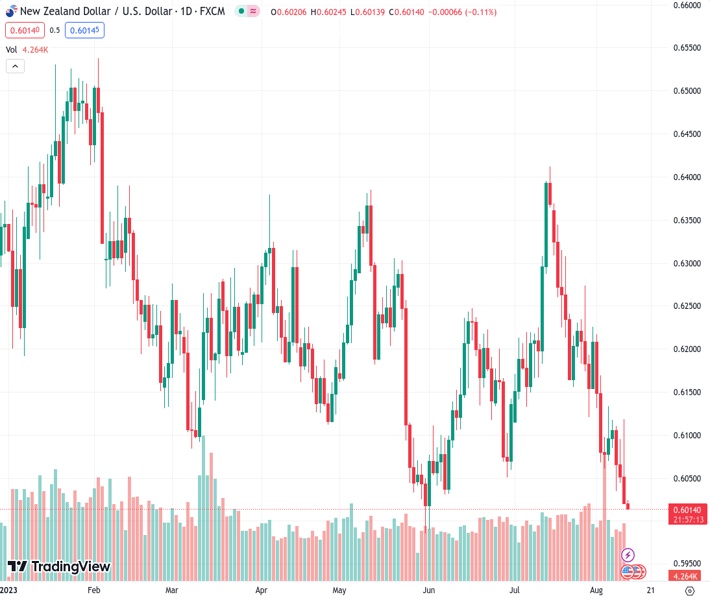
After the US inflation data was released, indicating a lower figure than expected, the NZDUSD currency pair saw a momentary increase.
…
This is a premium post.
[s2If !current_user_can(access_s2member_level4)]Please register for FREE REGISTER to read full post below containing analysis. In case of any error or you think you are not able to read the full post below, please email us at support#nehcap.com [lwa][/s2If] [s2If current_user_can(access_s2member_level1)]
- Following the release of the US inflation data, which came in below estimates, the NZD/USD experienced a brief surge.
The pair currently trades last at 0.60210.
The previous day high was 1.0995 while the previous day low was 1.0952. The daily 38.2% Fib levels comes at 1.0979, expected to provide resistance. Similarly, the daily 61.8% fib level is at 1.0969, expected to provide resistance.
NZD/USD began the Asian session on a positive note gaining 0.01% after Thursday’s session was characterized by a soft US inflation report that favored the Greenback, despite CPI being lower than estimates. The NZD/USD is trading at 0.6022, above its opening price.
The US Department of Labor revealed the July US Consumer Price Index (CPI), which printed 3.2% YoY above the prior month’s 3%, but below estimates of 3.3%; while excluding volatile items, the so-called core CPI, dipped to 4.7% YoY, below estimates and the previous month 4.8%.
Even though the CPI release supports a September pause, it’s too early to declare victory on inflation, said San Francisco Fed President Mary Daly. She refrained from deciding on the next month’s meeting, though she added she’s data dependent and pushed back against rate cuts.
After the headline crossed traders’ screens, the NZD/USD spiked, but the uptrend was short-lived, as the NZD/USD reversed its gains and closed at 0.6020 for a 0.50% loss. The Greenback recovered some ground toward the end of the session, with the US Dollar Index (DXY) finishing at 102.625, gaining 0.14%.
Surging US Treasury bond yields was another theme to consider, as the US 10-year benchmark note gained ten basis points, at 4.107%, after a weak US 30-year bond auction.
Other data revealed that the labor market gave another sign of easing, though it should be viewed cautiously, as the latest figures have not been consistent. Initial Jobless Claims for the week ending July 29 exceeded forecasts of 230K, advanced 248K.
On the New Zealand front, Business PMI came at 46.3, below expectations of 49.4, and trailed June’s 47.5. Recently a Reuters poll said that most analysts estimate the Reserve Bank of New Zealand (RBNZ) will keep rates unchanged at 5.50%, at a 14-year high, for the second straight meeting, on August 16. Only two of 29 analysts said that rates would need to rise to 5.75%.
Ahead on the US economic agenda, the release of the Producer Price Index (PPI) for July, alongside the University of Michigan Consumer Sentiment Poll, could pave the way for further downside on the NZD/USD. Inflation data pushing upwards can reignite discussions amongst Fed members to increase borrowing costs, suggesting further US Dollar strength. Otherwise, the NZD/USD could aim toward the 0.6100 figure ahead of the weekend.
Technical Levels: Supports and Resistances
NZDUSD currently trading at 1.0984 at the time of writing. Pair opened at 1.0974 and is trading with a change of 0.09 % .
| Overview | Overview.1 | |
|---|---|---|
| 0 | Today last price | 1.0984 |
| 1 | Today Daily Change | 0.0010 |
| 2 | Today Daily Change % | 0.0900 |
| 3 | Today daily open | 1.0974 |
The pair is trading below its 20 Daily moving average @ 1.1069, above its 50 Daily moving average @ 1.0953 , above its 100 Daily moving average @ 1.0926 and above its 200 Daily moving average @ 1.0761
| Trends | Trends.1 | |
|---|---|---|
| 0 | Daily SMA20 | 1.1069 |
| 1 | Daily SMA50 | 1.0953 |
| 2 | Daily SMA100 | 1.0926 |
| 3 | Daily SMA200 | 1.0761 |
The previous day high was 1.0995 while the previous day low was 1.0952. The daily 38.2% Fib levels comes at 1.0979, expected to provide resistance. Similarly, the daily 61.8% fib level is at 1.0969, expected to provide resistance.
Note the levels of interest below:
- Pivot support is noted at 1.0952, 1.0931, 1.0909
- Pivot resistance is noted at 1.0996, 1.1017, 1.1039
| Levels | Levels.1 |
|---|---|
| Previous Daily High | 1.0995 |
| Previous Daily Low | 1.0952 |
| Previous Weekly High | 1.1046 |
| Previous Weekly Low | 1.0912 |
| Previous Monthly High | 1.1276 |
| Previous Monthly Low | 1.0834 |
| Daily Fibonacci 38.2% | 1.0979 |
| Daily Fibonacci 61.8% | 1.0969 |
| Daily Pivot Point S1 | 1.0952 |
| Daily Pivot Point S2 | 1.0931 |
| Daily Pivot Point S3 | 1.0909 |
| Daily Pivot Point R1 | 1.0996 |
| Daily Pivot Point R2 | 1.1017 |
| Daily Pivot Point R3 | 1.1039 |
[/s2If]
Download Nehcap EAWe have two EAs that are operational on our LIVE accounts.
- EA-FIX: Check out the details here. Download EA-FIX . EA-FIX is a non-grid HFT scalper.
- EA-GROWTH: High quality low dd EA using trend grids. Download EA_GROWTHJoin Our Telegram Group
")


