#USDJPY @ 143.121 clings to mild gains during the first daily loss in three.
…
This is a premium post.
[s2If !current_user_can(access_s2member_level4)]Please register for FREE REGISTER to read full post below containing analysis. In case of any error or you think you are not able to read the full post below, please email us at support#nehcap.com [lwa][/s2If] [s2If current_user_can(access_s2member_level1)]
- USD/JPY clings to mild gains during the first daily loss in three.
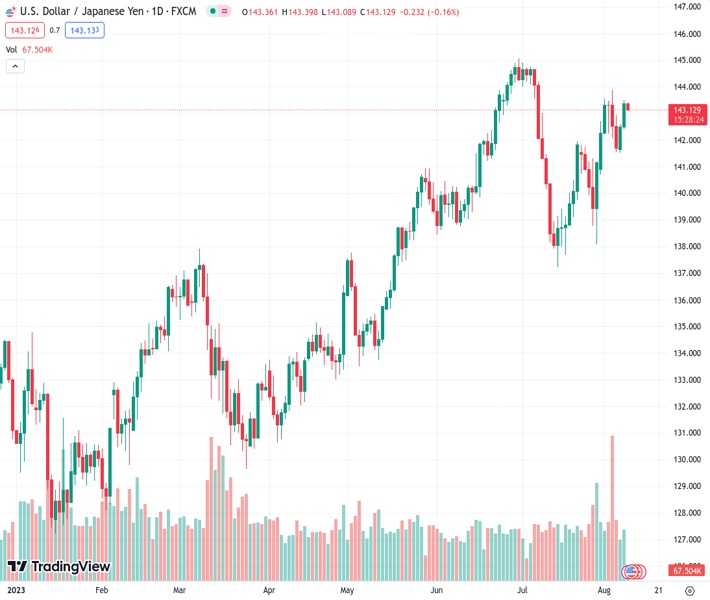
The pair currently trades last at 143.121.
The previous day high was 143.5 while the previous day low was 142.4. The daily 38.2% Fib levels comes at 143.08, expected to provide support. Similarly, the daily 61.8% fib level is at 142.82, expected to provide support.
USD/JPY remains on the back foot around 143.00 heading into Wednesday’s European session as it prints the first daily loss in three.
It’s worth noting, however, that the market’s inaction could be witnessed in the Yen pair’s latest momentum even if the US Dollar pares previous gains amid a shift in the sentiment. Also likely to have prod the risk-barometer pair could be the market’s preparations for the top-tier inflation clues from Japan and the US.
The improvement in China’s factory-gate inflation, namely the Producer Price Index (PPI), joins risk-positive news from the Biden Administration to tame the market’s previous pessimism and allows the Yen pair buyers to take a breather.
Previously, Italy’s surprise tax on the bank’s windfall profits, the global rating agencies’ downward revision of the US banks and financial institutions weighed on the sentiment on Tuesday and fuelled the USD/JPY. On the same line could be fears of the UK recession and slowing economic growth in China, not to forget Beijing’s geopolitical tension with Japan and the US.
On a different page, the recent downbeat performance of the US and Japanese Treasury bond yields, as well as fears about the Japan-China tension due to Tokyo’s friendship with Taiwan, also seem to weigh on the USD/JPY pair.
That said, the US 10-year Treasury bond yields remain pressured at the lowest level in a week marked the previous day, around 4.0%, whereas the 10-year Japanese Government Bonds (JGB) drops to the lowest levels in eight days to 0.58% by the press time.
It’s worth noting that the lower JGB yields defend the Bank of Japan’s (BoJ) easy-money policy while softer US bond coupons join the mildly bid S&P500 Futures to drag the US Dollar Index (DXY) from a 10-week-old falling resistance line.
Looking ahead, the ongoing weakness in the Treasury bond yields may allow the USD/JPY to consolidate weekly gains ahead of Thursday’s Japan Producer Price Index (PPI) and the US Consumer Price Index (CPI) data for July.
Although a clear recovery from the 50-DMA, around 141.50 by the press time, joins the upbeat oscillators to defend the USD/JPY buyers, a downward-sloping resistance line from October 2022, close to 143.80 at the latest appears a tough nut to crack for the bulls.
Technical Levels: Supports and Resistances
USDJPY currently trading at 143.17 at the time of writing. Pair opened at 143.38 and is trading with a change of -0.15% % .
| Overview | Overview.1 | |
|---|---|---|
| 0 | Today last price | 143.17 |
| 1 | Today Daily Change | -0.21 |
| 2 | Today Daily Change % | -0.15% |
| 3 | Today daily open | 143.38 |
The pair remains strongly bullish on the daily timeframe. It trades above its 20 SMA @ 140.84, 50 SMA 141.39, 100 SMA @ 138.1 and 200 SMA @ 136.53.
| Trends | Trends.1 | |
|---|---|---|
| 0 | Daily SMA20 | 140.84 |
| 1 | Daily SMA50 | 141.39 |
| 2 | Daily SMA100 | 138.10 |
| 3 | Daily SMA200 | 136.53 |
The previous day high was 143.5 while the previous day low was 142.4. The daily 38.2% Fib levels comes at 143.08, expected to provide support. Similarly, the daily 61.8% fib level is at 142.82, expected to provide support.
Note the levels of interest below:
- Pivot support is noted at 142.69, 142.0, 141.6
- Pivot resistance is noted at 143.78, 144.18, 144.87
| Levels | Levels.1 |
|---|---|
| Previous Daily High | 143.50 |
| Previous Daily Low | 142.40 |
| Previous Weekly High | 143.89 |
| Previous Weekly Low | 140.69 |
| Previous Monthly High | 144.91 |
| Previous Monthly Low | 137.24 |
| Daily Fibonacci 38.2% | 143.08 |
| Daily Fibonacci 61.8% | 142.82 |
| Daily Pivot Point S1 | 142.69 |
| Daily Pivot Point S2 | 142.00 |
| Daily Pivot Point S3 | 141.60 |
| Daily Pivot Point R1 | 143.78 |
| Daily Pivot Point R2 | 144.18 |
| Daily Pivot Point R3 | 144.87 |
[/s2If]
Download Nehcap EAWe have two EAs that are operational on our LIVE accounts.
- EA-FIX: Check out the details here. Download EA-FIX . EA-FIX is a non-grid HFT scalper.
- EA-GROWTH: High quality low dd EA using trend grids. Download EA_GROWTHJoin Our Telegram Group
")


