The USDINR pair has experienced its first decrease in value in three days, falling from a recent high and reversing its upward trend.
…
This is a premium post.
[s2If !current_user_can(access_s2member_level4)]Please register for FREE REGISTER to read full post below containing analysis. In case of any error or you think you are not able to read the full post below, please email us at support#nehcap.com [lwa][/s2If] [s2If current_user_can(access_s2member_level1)]
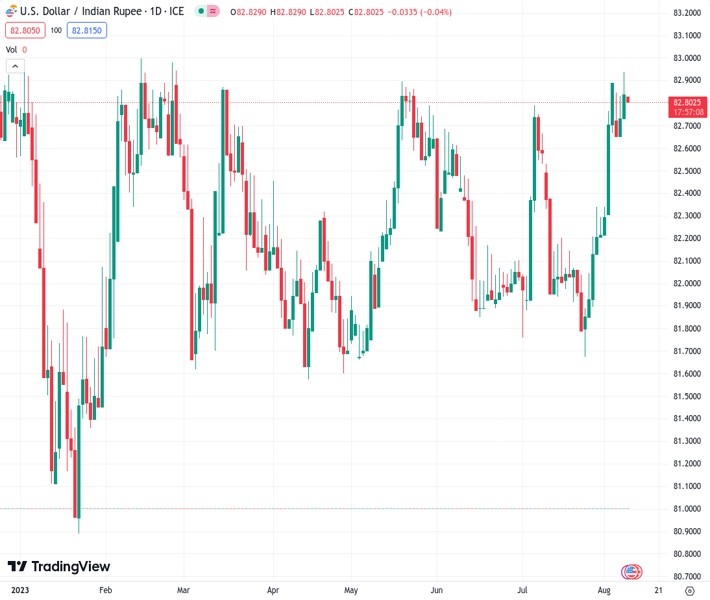
- USD/INR prints the first daily loss in three, retreats from multi-day high.
The pair currently trades last at 82.7980.
The previous day high was 83.1955 while the previous day low was 82.7185. The daily 38.2% Fib levels comes at 83.0133, expected to provide resistance. Similarly, the daily 61.8% fib level is at 82.9007, expected to provide resistance.
USD/INR retreats from the highest levels since late February while snapping a two-day winning streak around 82.80 during early Wednesday. In doing so, the Indian Rupee (INR) pair justifies the cautious optimism in Asia while also cheering the US Dollar’s pullback amid a sluggish Asian session. However, the broad fears about the banking sector and the anxiety ahead of Thursday’s Reserve Bank of India’s (RBI) monetary policy meeting, as well as the US Consumer Price Index (CPI), keep the pair’s moves in check.
The latest improvement in China’s factory-gate inflation and risk-positive news from the Biden Administration, cited by Bloomberg, seem to tame the pessimism in Asia despite the downbeat China Consumer Price Index (CPI) for July.
That said, CPI declines to -0.3% YoY versus -0.4% YoY expected and 0.0% prior whereas the Producer Price Index (PPI) improves to -4.4% YoY compared to -4.1% YoY market forecasts and -5.4% previous readings.
Elsewhere, Bloomberg cited anonymous officials familiar with the matter while saying, “The US plans to target only those Chinese companies that get more than 50% of revenue from the sectors including quantum computing and artificial intelligence (AI).”
While portraying the mood in Asia, the MSCI’s index of Asia–Pacific shares outside Japan prints mild gains by tracing the S&P500 Futures at the latest. Further, the US Treasury bond yields also remain dicey and prod the US Dollar Index (DXY) as it retreats from a 2.5-month-old descending resistance line to snap a two-day uptrend around 102.45 by the press time.
Additionally, mildly offered prices of WTI crude oil, down 0.20% intraday near $82.30 as we write, also weigh on the USD/INR price due to India’s reliance on energy imports and the heavy Current Account Deficit (CAD).
Previously, the pessimism emanating from Italy’s surprise tax on windfall profits of banks joined the global rating agencies’ downward revision of the US banks and financial institutions to weigh on the risk sentiment and fueled the USD/INR price. On the same line could be fears of the UK recession and slowing economic growth in China.
Looking ahead, the softer US inflation data may favor the USD/INR sellers but the RBI’s likely status quo may defend the Indian Rupee bears moving forward.
Unless providing a daily closing beneath the downward-sloping previous resistance line stretched from May 19, close to 82.60 by the press time, the USD/INR stays on the way to challenging the yearly high marked in January around the 83.00 round figure.
Technical Levels: Supports and Resistances
USDINR currently trading at 82.8112 at the time of writing. Pair opened at 82.92 and is trading with a change of -0.13% % .
| Overview | Overview.1 | |
|---|---|---|
| 0 | Today last price | 82.8112 |
| 1 | Today Daily Change | -0.1088 |
| 2 | Today Daily Change % | -0.13% |
| 3 | Today daily open | 82.92 |
The pair remains strongly bullish on the daily timeframe. It trades above its 20 SMA @ 82.276, 50 SMA 82.2566, 100 SMA @ 82.2055 and 200 SMA @ 82.167.
| Trends | Trends.1 | |
|---|---|---|
| 0 | Daily SMA20 | 82.2760 |
| 1 | Daily SMA50 | 82.2566 |
| 2 | Daily SMA100 | 82.2055 |
| 3 | Daily SMA200 | 82.1670 |
The previous day high was 83.1955 while the previous day low was 82.7185. The daily 38.2% Fib levels comes at 83.0133, expected to provide resistance. Similarly, the daily 61.8% fib level is at 82.9007, expected to provide resistance.
Note the levels of interest below:
- Pivot support is noted at 82.6939, 82.4677, 82.2169
- Pivot resistance is noted at 83.1709, 83.4217, 83.6479
| Levels | Levels.1 |
|---|---|
| Previous Daily High | 83.1955 |
| Previous Daily Low | 82.7185 |
| Previous Weekly High | 82.8996 |
| Previous Weekly Low | 82.2000 |
| Previous Monthly High | 82.8334 |
| Previous Monthly Low | 81.6588 |
| Daily Fibonacci 38.2% | 83.0133 |
| Daily Fibonacci 61.8% | 82.9007 |
| Daily Pivot Point S1 | 82.6939 |
| Daily Pivot Point S2 | 82.4677 |
| Daily Pivot Point S3 | 82.2169 |
| Daily Pivot Point R1 | 83.1709 |
| Daily Pivot Point R2 | 83.4217 |
| Daily Pivot Point R3 | 83.6479 |
[/s2If]
Download Nehcap EAWe have two EAs that are operational on our LIVE accounts.
- EA-FIX: Check out the details here. Download EA-FIX . EA-FIX is a non-grid HFT scalper.
- EA-GROWTH: High quality low dd EA using trend grids. Download EA_GROWTHJoin Our Telegram Group
")


