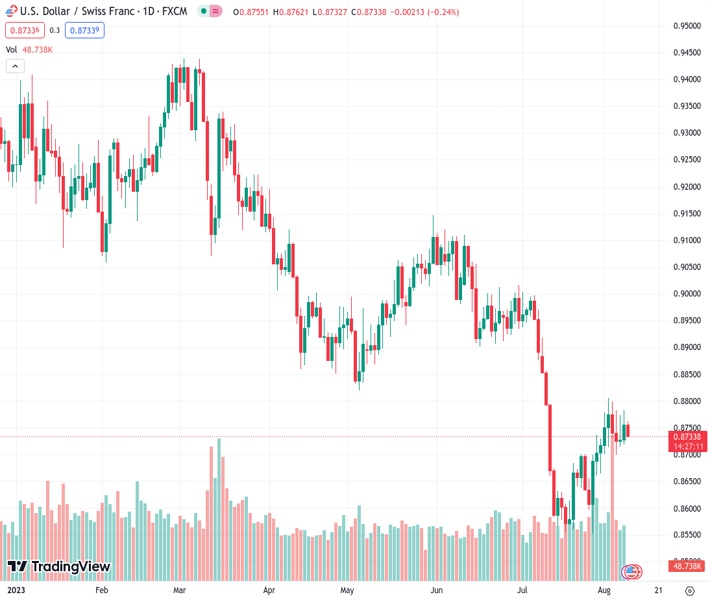
The USDCHF currency pair remains close to its intraday low of 0.87355, experiencing its first day of losses in three days.
…
This is a premium post.
[s2If !current_user_can(access_s2member_level4)]Please register for FREE REGISTER to read full post below containing analysis. In case of any error or you think you are not able to read the full post below, please email us at support#nehcap.com [lwa][/s2If] [s2If current_user_can(access_s2member_level1)]
- USD/CHF holds lower grounds near intraday bottom during the first loss-making day in three.
The pair currently trades last at 0.87355.
The previous day high was 0.8783 while the previous day low was 0.872. The daily 38.2% Fib levels comes at 0.8759, expected to provide resistance. Similarly, the daily 61.8% fib level is at 0.8744, expected to provide resistance.
USD/CHF remains on the back foot at the intraday low of around 0.8735 amid the early hours of Wednesday’s European session. In doing so, the Swiss Franc (CHF) pair prints the first daily loss in three as the US Dollar reverses from the key upside hurdle due to the market’s positioning for the key inflation data, as well as backed by China news.
US Dollar Index (DXY) retreats from a downward-sloping resistance line from May 31 while printing the first daily loss in three around 102.35, down 0.16% intraday as the market’s previous risk aversion fades.
While portraying the mood, S&P500 Futures recovers from the monthly low marked the previous day and prints mild gains around 4,525 whereas the US 10-year Treasury bond yields remain pressured at the lowest level in a week marked the previous day, around 4.0% by the press time.
It’s worth observing that improvement in China’s Producer Price Index (PPI) for July contrasted with the downbeat Consumer Price Index (CPI) data for the said month to tame pessimism about the world’s biggest industrial players. Also improving the risk appetite is the news from the White House as the Biden Administration signals relief to China technology companies. “The US plans to target only those Chinese companies that get more than 50% of revenue from the sectors including quantum computing and artificial intelligence (AI),” said the news.
On the contrary, Italy’s surprise tax on windfall profits of banks joined the global rating agencies’ downward revision to the US banks and financial institutions to weigh on the risk sentiment the previous day. On the same line could be fears of the UK recession and slowing economic growth in China, not to forget the Dragon Nation’s geopolitical tension with the US and Japan about Taiwan.
Given the market’s preparations for the US CPI for July, up for publishing on Thursday, the USD/CHF may witness further downside. However, strong US inflation numbers and the risk-off mood can push the Swiss Franc pair toward the key technical resistances.
Despite the latest retreat, the USD/CHF pair remains beyond the 10-DMA support of around 0.8730, which in turn joins upbeat oscillators to suggest the quote’s further upside towards a descending resistance line stretched from November 2022, close to 0.8830 at the latest.
Technical Levels: Supports and Resistances
USDCHF currently trading at 0.8739 at the time of writing. Pair opened at 0.8757 and is trading with a change of -0.21% % .
| Overview | Overview.1 | |
|---|---|---|
| 0 | Today last price | 0.8739 |
| 1 | Today Daily Change | -0.0018 |
| 2 | Today Daily Change % | -0.21% |
| 3 | Today daily open | 0.8757 |
The pair is trading above its 20 Daily moving average @ 0.8675, below its 50 Daily moving average @ 0.8861 , below its 100 Daily moving average @ 0.8934 and below its 200 Daily moving average @ 0.9143
| Trends | Trends.1 | |
|---|---|---|
| 0 | Daily SMA20 | 0.8675 |
| 1 | Daily SMA50 | 0.8861 |
| 2 | Daily SMA100 | 0.8934 |
| 3 | Daily SMA200 | 0.9143 |
The previous day high was 0.8783 while the previous day low was 0.872. The daily 38.2% Fib levels comes at 0.8759, expected to provide resistance. Similarly, the daily 61.8% fib level is at 0.8744, expected to provide resistance.
Note the levels of interest below:
- Pivot support is noted at 0.8724, 0.8691, 0.8661
- Pivot resistance is noted at 0.8787, 0.8816, 0.8849
| Levels | Levels.1 |
|---|---|
| Previous Daily High | 0.8783 |
| Previous Daily Low | 0.8720 |
| Previous Weekly High | 0.8806 |
| Previous Weekly Low | 0.8665 |
| Previous Monthly High | 0.9005 |
| Previous Monthly Low | 0.8552 |
| Daily Fibonacci 38.2% | 0.8759 |
| Daily Fibonacci 61.8% | 0.8744 |
| Daily Pivot Point S1 | 0.8724 |
| Daily Pivot Point S2 | 0.8691 |
| Daily Pivot Point S3 | 0.8661 |
| Daily Pivot Point R1 | 0.8787 |
| Daily Pivot Point R2 | 0.8816 |
| Daily Pivot Point R3 | 0.8849 |
[/s2If]
Download Nehcap EAWe have two EAs that are operational on our LIVE accounts.
- EA-FIX: Check out the details here. Download EA-FIX . EA-FIX is a non-grid HFT scalper.
- EA-GROWTH: High quality low dd EA using trend grids. Download EA_GROWTHJoin Our Telegram Group
")


