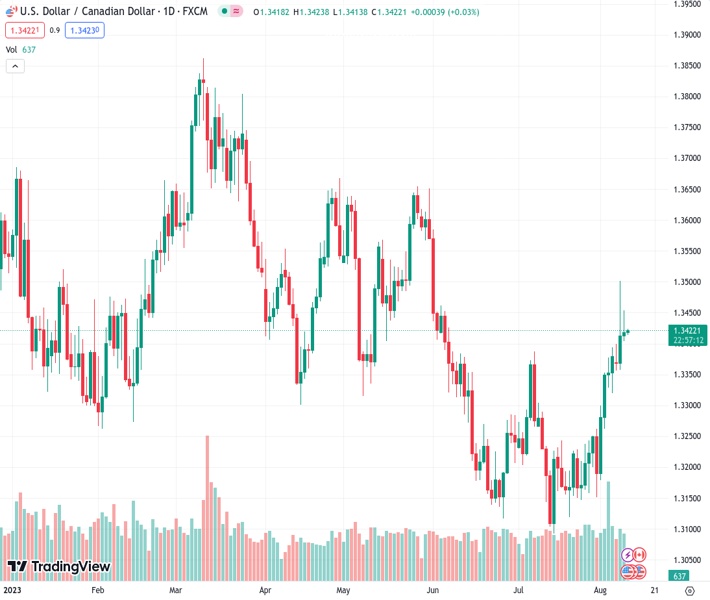
The USD to CAD exchange rate hit the 200-day Simple Moving Average (SMA), but subsequently dropped to 1.3420.
…
This is a premium post.
[s2If !current_user_can(access_s2member_level4)]Please register for FREE REGISTER to read full post below containing analysis. In case of any error or you think you are not able to read the full post below, please email us at support#nehcap.com [lwa][/s2If] [s2If current_user_can(access_s2member_level1)]
- The USD/CAD reached the 200-day SMA but then fell to 1.3420.
The pair currently trades last at 1.34193.
The previous day high was 1.3502 while the previous day low was 1.3365. The daily 38.2% Fib levels comes at 1.345, expected to provide resistance. Similarly, the daily 61.8% fib level is at 1.3417, expected to provide support.
The USD/CAD traded flat near the 1.3420 area on Wednesday. On the US side, no relevant data was released, while investor remains cautious ahead of Thursday’s Consumer Price Index (CPI) data from July. However, the Loonie gained strength from robust Canadian Building Permits for July, and Oil prices rising to highs since November 2022.
After two days of trading strong, the USD backed off somewhat, with the DXY index consolidating at 102.50. As the American economic calendar remains empty, the focus is on inflation data on Thursday which projections see the headline CPI slightly accelerating to 3.3% YoY and the Core CPI coming in at 4.8%.
On the CAD’s side, Building Permits from Canada from July unexpectedly rose by 6.1% MoM in July, while markets expected a 3.5% decline and boosted the Loonie. In addition, the West Texas Intermediate (WTI) barrel jumped above $84.00 for the first time since November 2022 and helped the CAD to trade resilient against its rivals.
According to the daily chart, the technical outlook remains neutral to bullish for the short term as the bulls gain momentum. The Relative Strength Index (RSI) points north above its middle point, while the Moving Average Convergence (MACD) histogram displays larger green bars. Plus, the pair is above the 20 and 100-day Simple Moving Averages (SMA) but below the 200-day SMA, suggesting that on the bigger picture, the bulls are still in command over the bears but still need to overcome the 1.3500 level to confirm to upside.
Support levels: 1.3450, 1.3400,1.3320.
Resistance levels: 1.3500 (200-day SMA), 1.3550, 1.3570.
Technical Levels: Supports and Resistances
USDCAD currently trading at 1.3421 at the time of writing. Pair opened at 1.3419 and is trading with a change of 0.01 % .
| Overview | Overview.1 | |
|---|---|---|
| 0 | Today last price | 1.3421 |
| 1 | Today Daily Change | 0.0002 |
| 2 | Today Daily Change % | 0.0100 |
| 3 | Today daily open | 1.3419 |
The pair is trading above its 20 Daily moving average @ 1.324, above its 50 Daily moving average @ 1.3271 , above its 100 Daily moving average @ 1.3396 and below its 200 Daily moving average @ 1.3454
| Trends | Trends.1 | |
|---|---|---|
| 0 | Daily SMA20 | 1.3240 |
| 1 | Daily SMA50 | 1.3271 |
| 2 | Daily SMA100 | 1.3396 |
| 3 | Daily SMA200 | 1.3454 |
The previous day high was 1.3502 while the previous day low was 1.3365. The daily 38.2% Fib levels comes at 1.345, expected to provide resistance. Similarly, the daily 61.8% fib level is at 1.3417, expected to provide support.
Note the levels of interest below:
- Pivot support is noted at 1.3355, 1.3292, 1.3218
- Pivot resistance is noted at 1.3492, 1.3566, 1.3629
| Levels | Levels.1 |
|---|---|
| Previous Daily High | 1.3502 |
| Previous Daily Low | 1.3365 |
| Previous Weekly High | 1.3394 |
| Previous Weekly Low | 1.3151 |
| Previous Monthly High | 1.3387 |
| Previous Monthly Low | 1.3093 |
| Daily Fibonacci 38.2% | 1.3450 |
| Daily Fibonacci 61.8% | 1.3417 |
| Daily Pivot Point S1 | 1.3355 |
| Daily Pivot Point S2 | 1.3292 |
| Daily Pivot Point S3 | 1.3218 |
| Daily Pivot Point R1 | 1.3492 |
| Daily Pivot Point R2 | 1.3566 |
| Daily Pivot Point R3 | 1.3629 |
[/s2If]
Download Nehcap EAWe have two EAs that are operational on our LIVE accounts.
- EA-FIX: Check out the details here. Download EA-FIX . EA-FIX is a non-grid HFT scalper.
- EA-GROWTH: High quality low dd EA using trend grids. Download EA_GROWTHJoin Our Telegram Group
")


