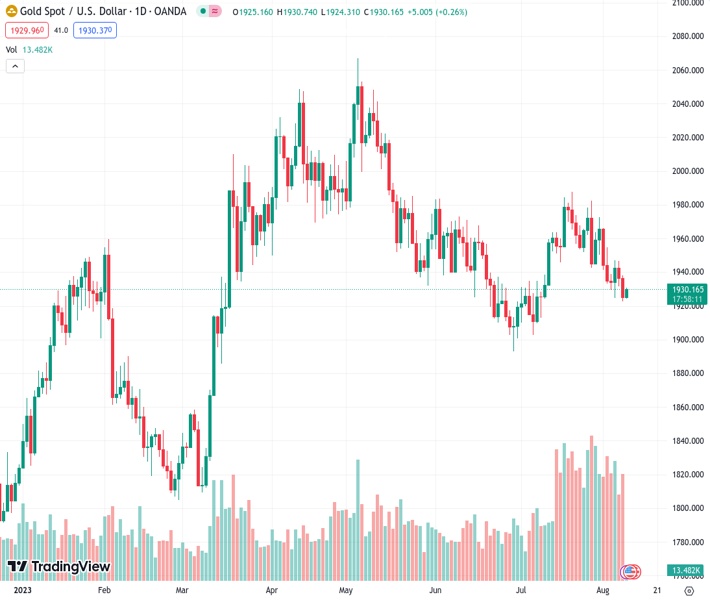
The price of gold, at 1,929.80 for the XAUUSD pair, has gained momentum and is supported by various factors.
…
This is a premium post.
[s2If !current_user_can(access_s2member_level4)]Please register for FREE REGISTER to read full post below containing analysis. In case of any error or you think you are not able to read the full post below, please email us at support#nehcap.com [lwa][/s2If] [s2If current_user_can(access_s2member_level1)]
- Gold price regains positive traction and draws support from a combination of factors.
The pair currently trades last at 1929.80.
The previous day high was 1938.17 while the previous day low was 1922.83. The daily 38.2% Fib levels comes at 1928.69, expected to provide support. Similarly, the daily 61.8% fib level is at 1932.31, expected to provide resistance.
Gold price attracts some buying during the Asian session on Wednesday and recovers a part of the previous day’s losses to the $1,923-$1,922 area, or a four-week low. The XAU/USD currently trades just below the $1,930 level, up nearly 0.20% for the day, though any meaningful upside still seems elusive.
A generally softer tone around the equity markets, along with a modest US Dollar (USD) downtick, turn out to be a key factor lending some support to the Gold price. Weaker Chinese trade data released on Tuesday revived fears about the worsening outlook for the world’s second-largest economy. Adding to this, Moody’s downgraded the debt ratings for a slew of US banks and dampened investors’ appetite for riskier assets. The anti-risk flow tends to benefit the safe-haven precious metal.
Meanwhile, the USD Index (DXY), which tracks the Greenback against a basket of currencies, remains depressed below a one-month top tested on Tuesday and further benefits the US Dollar-denominated Gold price. The overnight dovish remarks by Philadelphia Federal Reserve Bank President Patrick Harker, saying that they will probably start lowering the policy rate sometime next year, hold back the USD bulls from placing fresh bets, though the downside is more likely to remain limited.
Market participants now seem convinced that the Fed will stick to its hawkish stance in the wake of an extremely resilient US economy. The bets were lifted by the closely-watched US jobs report, which pointed to the continued tightness in the labour market and raised the odds of a soft landing. Adding to this, Fed Governor Michele Bowman on Monday kept the door for one more 25 bps lift-off in September or November wide open and should continue to act as a tailwind for the USD.
Traders might also prefer to move to the sidelines ahead of the release of the latest US consumer inflation figures on Thursday. The crucial US CPI report will play a key role in influencing market expectations about the Fed’s future rate-hike path. This, in turn, will drive the USD demand and help determine the next leg of a directional move for the Gold price. Hence, it will be prudent to wait for strong follow-through buying to confirm that the XAU/USD has formed a near-term bottom.
Technical Levels: Supports and Resistances
XAUUSD currently trading at 1928.88 at the time of writing. Pair opened at 1925.32 and is trading with a change of 0.18 % .
| Overview | Overview.1 | |
|---|---|---|
| 0 | Today last price | 1928.88 |
| 1 | Today Daily Change | 3.56 |
| 2 | Today Daily Change % | 0.18 |
| 3 | Today daily open | 1925.32 |
The pair is trading below its 20 Daily moving average @ 1954.76, below its 50 Daily moving average @ 1944.35 , below its 100 Daily moving average @ 1968.03 and above its 200 Daily moving average @ 1897.82
| Trends | Trends.1 | |
|---|---|---|
| 0 | Daily SMA20 | 1954.76 |
| 1 | Daily SMA50 | 1944.35 |
| 2 | Daily SMA100 | 1968.03 |
| 3 | Daily SMA200 | 1897.82 |
The previous day high was 1938.17 while the previous day low was 1922.83. The daily 38.2% Fib levels comes at 1928.69, expected to provide support. Similarly, the daily 61.8% fib level is at 1932.31, expected to provide resistance.
Note the levels of interest below:
- Pivot support is noted at 1919.38, 1913.43, 1904.04
- Pivot resistance is noted at 1934.72, 1944.11, 1950.06
| Levels | Levels.1 |
|---|---|
| Previous Daily High | 1938.17 |
| Previous Daily Low | 1922.83 |
| Previous Weekly High | 1972.45 |
| Previous Weekly Low | 1925.72 |
| Previous Monthly High | 1987.54 |
| Previous Monthly Low | 1902.77 |
| Daily Fibonacci 38.2% | 1928.69 |
| Daily Fibonacci 61.8% | 1932.31 |
| Daily Pivot Point S1 | 1919.38 |
| Daily Pivot Point S2 | 1913.43 |
| Daily Pivot Point S3 | 1904.04 |
| Daily Pivot Point R1 | 1934.72 |
| Daily Pivot Point R2 | 1944.11 |
| Daily Pivot Point R3 | 1950.06 |
[/s2If]
Download Nehcap EAWe have two EAs that are operational on our LIVE accounts.
- EA-FIX: Check out the details here. Download EA-FIX . EA-FIX is a non-grid HFT scalper.
- EA-GROWTH: High quality low dd EA using trend grids. Download EA_GROWTHJoin Our Telegram Group
")


