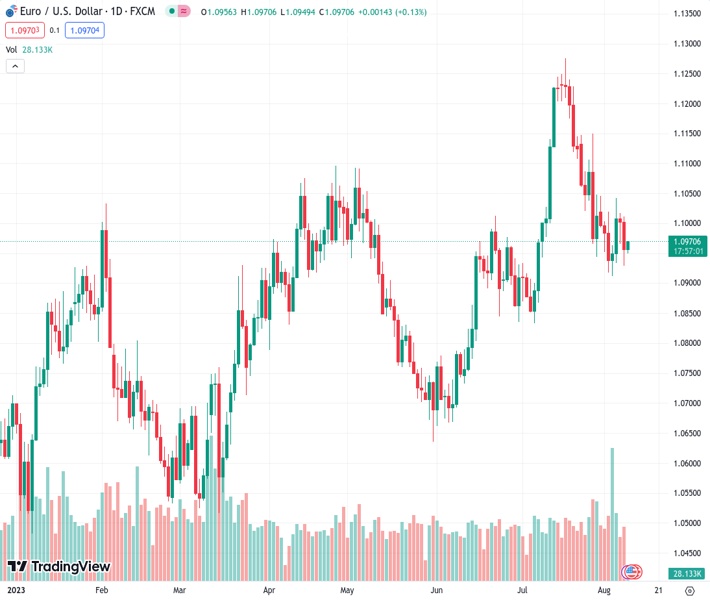
The EURUSD currency pair, currently trading at a rate of 1.09683, has recorded its first increase in value within a symmetrical triangle pattern in three days. According to the viewpoint of @nehcap, the market sentiment is bearish.
…
This is a premium post.
[s2If !current_user_can(access_s2member_level4)]Please register for FREE REGISTER to read full post below containing analysis. In case of any error or you think you are not able to read the full post below, please email us at support#nehcap.com [lwa][/s2If] [s2If current_user_can(access_s2member_level1)]
- EUR/USD prints the first daily gains in three within two-month-old symmetrical triangle.
The pair currently trades last at 1.09683.
The previous day high was 1.1011 while the previous day low was 1.0929. The daily 38.2% Fib levels comes at 1.0961, expected to provide support. Similarly, the daily 61.8% fib level is at 1.098, expected to provide resistance.
EUR/USD consolidates weekly losses amid Wednesday’s sluggish morning in Europe. In doing so, the Euro pair licks its wounds within a two-month-old symmetrical triangle as market sentiment improves a bit on news and data surrounding China.
That said, the improvement in China’s factory-gate inflation supersedes the downbeat consumer price increase to underpin recent stabilization in the market. Further, the latest risk-positive news from the Biden Administration, cited by Bloomberg, also allows the EUR/USD traders to lick their wounds. “The US plans to target only those Chinese companies that get more than 50% of revenue from the sectors including quantum computing and artificial intelligence (AI),” said the news.
It’s worth noting that the pessimism emanating from Italy’s surprise tax on windfall profits of banks joined the global rating agencies’ downward revision of the US banks and financial institutions to weigh on the risk sentiment and the EUR/USD price. On the same line could be fears of the UK recession and slowing economic growth in China.
Technically, the Euro pair’s rebound from the bottom line of the aforementioned triangle joins the upbeat RSI (14) line, not overbought, to defend the EUR/USD bulls.
However, the stated triangle’s top line around the 1.1000 psychological magnet precedes the 200-SMA hurdle of around 1.1020 to restrict the short-term EUR/USD upside.
Meanwhile, a downside break of the triangle’s support line, close to 1.0930 by the press time, can amplify the bearish bias about the Europe pair and drag it towards the previous monthly low of around 1.0830.
Though, the August 03 trough surrounding 1.0910 and the 1.0900 may prod the EUR/USD bears.
Trend: Bearish
Technical Levels: Supports and Resistances
EURUSD currently trading at 1.0964 at the time of writing. Pair opened at 1.0956 and is trading with a change of 0.07% % .
| Overview | Overview.1 | |
|---|---|---|
| 0 | Today last price | 1.0964 |
| 1 | Today Daily Change | 0.0008 |
| 2 | Today Daily Change % | 0.07% |
| 3 | Today daily open | 1.0956 |
The pair is trading below its 20 Daily moving average @ 1.1077, above its 50 Daily moving average @ 1.0947 , above its 100 Daily moving average @ 1.0925 and above its 200 Daily moving average @ 1.0756
| Trends | Trends.1 | |
|---|---|---|
| 0 | Daily SMA20 | 1.1077 |
| 1 | Daily SMA50 | 1.0947 |
| 2 | Daily SMA100 | 1.0925 |
| 3 | Daily SMA200 | 1.0756 |
The previous day high was 1.1011 while the previous day low was 1.0929. The daily 38.2% Fib levels comes at 1.0961, expected to provide support. Similarly, the daily 61.8% fib level is at 1.098, expected to provide resistance.
Note the levels of interest below:
- Pivot support is noted at 1.092, 1.0884, 1.0838
- Pivot resistance is noted at 1.1002, 1.1048, 1.1084
| Levels | Levels.1 |
|---|---|
| Previous Daily High | 1.1011 |
| Previous Daily Low | 1.0929 |
| Previous Weekly High | 1.1046 |
| Previous Weekly Low | 1.0912 |
| Previous Monthly High | 1.1276 |
| Previous Monthly Low | 1.0834 |
| Daily Fibonacci 38.2% | 1.0961 |
| Daily Fibonacci 61.8% | 1.0980 |
| Daily Pivot Point S1 | 1.0920 |
| Daily Pivot Point S2 | 1.0884 |
| Daily Pivot Point S3 | 1.0838 |
| Daily Pivot Point R1 | 1.1002 |
| Daily Pivot Point R2 | 1.1048 |
| Daily Pivot Point R3 | 1.1084 |
[/s2If]
Download Nehcap EAWe have two EAs that are operational on our LIVE accounts.
- EA-FIX: Check out the details here. Download EA-FIX . EA-FIX is a non-grid HFT scalper.
- EA-GROWTH: High quality low dd EA using trend grids. Download EA_GROWTHJoin Our Telegram Group
")


