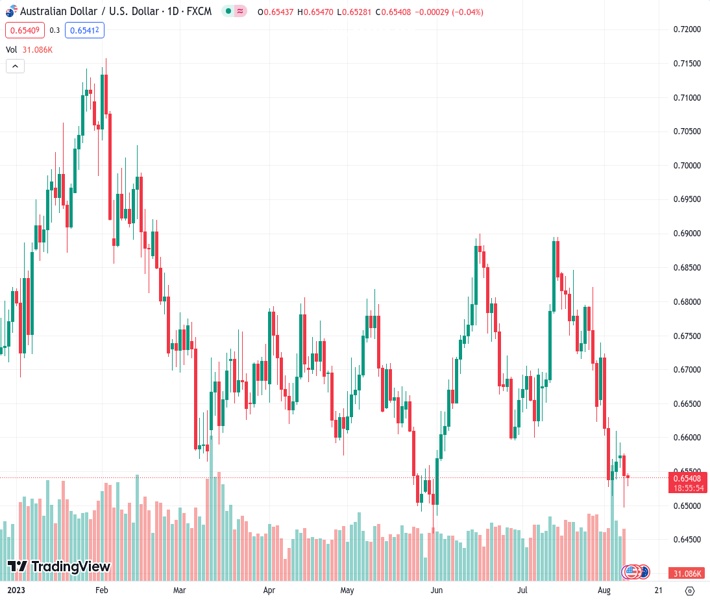
The AUDUSD pair, currently trading at 0.65413, resists a corrective rebound from a two-month low due to positive Chinese data that alleviates concerns about deflation.
…
This is a premium post.
[s2If !current_user_can(access_s2member_level4)]Please register for FREE REGISTER to read full post below containing analysis. In case of any error or you think you are not able to read the full post below, please email us at support#nehcap.com [lwa][/s2If] [s2If current_user_can(access_s2member_level1)]
- AUD/USD defends corrective bounce off two-month low after China data turns down deflation woes.
The pair currently trades last at 0.65413.
The previous day high was 0.6576 while the previous day low was 0.6496. The daily 38.2% Fib levels comes at 0.6527, expected to provide support. Similarly, the daily 61.8% fib level is at 0.6546, expected to provide resistance.
AUD/USD remains sidelined near the intraday high surrounding 0.6550 as China inflation data flashes mixed signals during early Wednesday. In doing so, the Aussie pair defends the late Tuesday’s corrective bounce off the lowest levels in two months as the market stabilizes after a volatile day.
China’s headline inflation gauge, namely the Consumer Price Index (CPI), declines to -0.3% YoY versus -0.4% YoY expected and 0.0% prior whereas the Producer Price Index (PPI) improves to -4.4% YoY compared to -4.1% YoY market forecasts and -5.4% previous readings.
Apart from the China inflation data, the latest risk-positive news from the Biden Administration, cited by Bloomberg, also allows the AUD/USD pair to lick its wounds at the multi-day low. “The US plans to target only those Chinese companies that get more than 50% of revenue from the sectors including quantum computing and artificial intelligence (AI),” said the news.
Elsewhere, the market’s consolidation after a heavy risk aversion might have also allowed the AUD/USD to remain sidelined.
Even so, the looming bankruptcies of the top-tier China real estate players and hardships for global banks, due to the latest move from Italy and the leading rating agencies, seem to keep a tab on the AUD/USD price.
Against this backdrop, Wall Street closed in the red with major losses among the bank stocks whereas the US 10-year Treasury bond yields dropped to the weekly low of around 3.98% before bouncing off 4.03% by the day’s end. That said, S&P500 Futures remains mildly bid by the press time.
Looking ahead, a lack of major data/events may allow the AUD/USD pair to consolidate the weekly loss before Thursday’s Australia Consumer Inflation Expectations for August and the all-important US CPI.
The nearly oversold RSI (14) conditions test the AUD/USD bears despite breaking a 10-month-old rising trend line, now immediate resistance near 0.6550. However, an ascending support line stretched from early November, around 0.6480, challenges the quote’s further declines.
Technical Levels: Supports and Resistances
AUDUSD currently trading at 0.654 at the time of writing. Pair opened at 0.6544 and is trading with a change of -0.06% % .
| Overview | Overview.1 | |
|---|---|---|
| 0 | Today last price | 0.654 |
| 1 | Today Daily Change | -0.0004 |
| 2 | Today Daily Change % | -0.06% |
| 3 | Today daily open | 0.6544 |
The pair remains strongly bearish on the daily time frame. It trades below the 20 SMA @ 0.6709, 50 SMA 0.6703, 100 SMA @ 0.6687 and 200 SMA @ 0.6735.
| Trends | Trends.1 | |
|---|---|---|
| 0 | Daily SMA20 | 0.6709 |
| 1 | Daily SMA50 | 0.6703 |
| 2 | Daily SMA100 | 0.6687 |
| 3 | Daily SMA200 | 0.6735 |
The previous day high was 0.6576 while the previous day low was 0.6496. The daily 38.2% Fib levels comes at 0.6527, expected to provide support. Similarly, the daily 61.8% fib level is at 0.6546, expected to provide resistance.
Note the levels of interest below:
- Pivot support is noted at 0.6501, 0.6459, 0.6422
- Pivot resistance is noted at 0.6581, 0.6619, 0.6661
| Levels | Levels.1 |
|---|---|
| Previous Daily High | 0.6576 |
| Previous Daily Low | 0.6496 |
| Previous Weekly High | 0.6740 |
| Previous Weekly Low | 0.6514 |
| Previous Monthly High | 0.6895 |
| Previous Monthly Low | 0.6599 |
| Daily Fibonacci 38.2% | 0.6527 |
| Daily Fibonacci 61.8% | 0.6546 |
| Daily Pivot Point S1 | 0.6501 |
| Daily Pivot Point S2 | 0.6459 |
| Daily Pivot Point S3 | 0.6422 |
| Daily Pivot Point R1 | 0.6581 |
| Daily Pivot Point R2 | 0.6619 |
| Daily Pivot Point R3 | 0.6661 |
[/s2If]
Download Nehcap EAWe have two EAs that are operational on our LIVE accounts.
- EA-FIX: Check out the details here. Download EA-FIX . EA-FIX is a non-grid HFT scalper.
- EA-GROWTH: High quality low dd EA using trend grids. Download EA_GROWTHJoin Our Telegram Group
")


