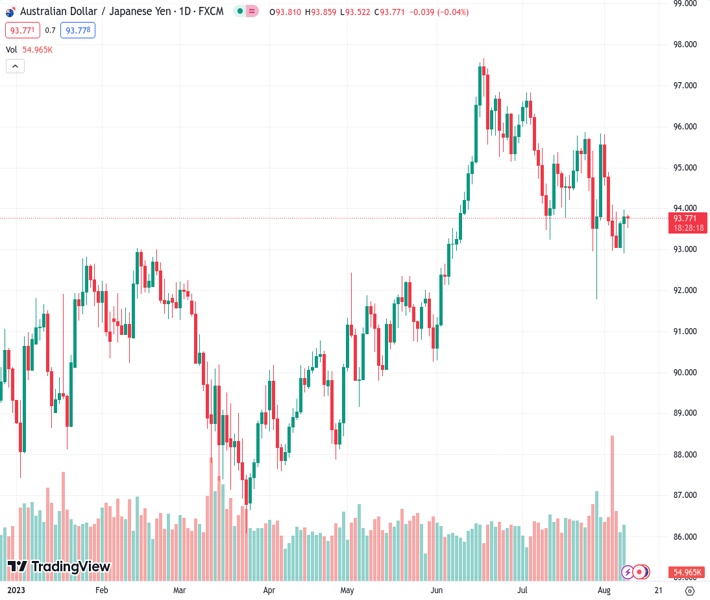
The AUDJPY pair at a rate of 93.7720 is finding it difficult to make progress and is currently trading at approximately 93.77, experiencing a 0.05% loss for the day.
…
This is a premium post.
[s2If !current_user_can(access_s2member_level4)]Please register for FREE REGISTER to read full post below containing analysis. In case of any error or you think you are not able to read the full post below, please email us at support#nehcap.com [lwa][/s2If] [s2If current_user_can(access_s2member_level1)]
- AUD/JPY struggles to gain and currently trades around 93.77, losing 0.05% on the day.
The pair currently trades last at 93.7720.
The previous day high was 93.98 while the previous day low was 92.9. The daily 38.2% Fib levels comes at 93.57, expected to provide support. Similarly, the daily 61.8% fib level is at 93.32, expected to provide support.
The AUD/JPY cross remains on the defensive below the 94.00 mark during the early Asian session on Wednesday. The cross currently trades around 93.77, down 0.05% for the day. The Chinese inflation data fails to inspire the China-proxy Australian Dollar (AUD).
The latest data on Wednesday showed that the Chinese Consumer Price Index (CPI) YoY fell 0.3% in July from 0% prior, and the market consensus anticipated a -0.4% decline. Meanwhile, the Producer Price Index (PPI) declined 4.4% YoY, compared to the 4.1% decrease YoY expected and a 5.4% drop prior.
Earlier this week, China’s trade balance increased to $80.6 billion, exceeding expectations of $70.6 billion and $70.62 billion prior. While, the dollar value of China’s exports YoY in July plunged -14.5%, worse than expectations of -12.5% in June, and Imports dropped -12.4% YoY from -5%.
On the Aussie front, Westpac Consumer Confidence in Australia fell to -0.4% in August, down from 2.7% the previous month. Meanwhile, the National Australia Bank’s (NAB) Business Conditions for July increased to 10.0 from 9.0 prior, above the market consensus of 8.0. Lastly, the NAB Business Confidence increased to 2.0% from -1.0% estimations and 0.0% prior. That said, the mixed economic reading from Australia and China fails to inspire the Aussie.
In Japan, Household Spending YoY dropped from 4.0% to 4.2% in June, a fourth month of decline. Average Cash Earnings y/y came in at 2.3% from 2.9%, which was worse than the estimated 3.0%. Further detail revealed that households with two or more people spent an average of 275,545 yen ($1,900). This figure could raise concerns about the Bank of Japan’s (BoJ) ultra-loose monetary policy.
Nevertheless, the Summary of Opinions released by the Bank of Japan on Monday revealed that the policymaker supports maintaining ultra-low interest rates until robust domestic demand and higher wages replace cost-push factors as the primary drivers of price increases and maintain sustainable inflation around its target.
Looking ahead, the Australian and Japanese dockets will not release top-tier data this week. However, market participants will take cues from the Japanese Producer Price Index (PPI) for July and the Australian Consumer Inflation Expectation for August, due on Thursday. The next week’s highlight will be the Reserve Bank of Australia (RBA) Monetary Policy Meeting Minutes. Traders will find opportunities around the AUD/JPY cross.
Technical Levels: Supports and Resistances
AUDJPY currently trading at 93.72 at the time of writing. Pair opened at 93.82 and is trading with a change of -0.11 % .
| Overview | Overview.1 | |
|---|---|---|
| 0 | Today last price | 93.72 |
| 1 | Today Daily Change | -0.10 |
| 2 | Today Daily Change % | -0.11 |
| 3 | Today daily open | 93.82 |
The pair is trading below its 20 Daily moving average @ 94.47, below its 50 Daily moving average @ 94.76 , above its 100 Daily moving average @ 92.34 and above its 200 Daily moving average @ 91.91
| Trends | Trends.1 | |
|---|---|---|
| 0 | Daily SMA20 | 94.47 |
| 1 | Daily SMA50 | 94.76 |
| 2 | Daily SMA100 | 92.34 |
| 3 | Daily SMA200 | 91.91 |
The previous day high was 93.98 while the previous day low was 92.9. The daily 38.2% Fib levels comes at 93.57, expected to provide support. Similarly, the daily 61.8% fib level is at 93.32, expected to provide support.
Note the levels of interest below:
- Pivot support is noted at 93.16, 92.49, 92.08
- Pivot resistance is noted at 94.24, 94.65, 95.31
| Levels | Levels.1 |
|---|---|
| Previous Daily High | 93.98 |
| Previous Daily Low | 92.90 |
| Previous Weekly High | 95.83 |
| Previous Weekly Low | 92.97 |
| Previous Monthly High | 96.84 |
| Previous Monthly Low | 91.79 |
| Daily Fibonacci 38.2% | 93.57 |
| Daily Fibonacci 61.8% | 93.32 |
| Daily Pivot Point S1 | 93.16 |
| Daily Pivot Point S2 | 92.49 |
| Daily Pivot Point S3 | 92.08 |
| Daily Pivot Point R1 | 94.24 |
| Daily Pivot Point R2 | 94.65 |
| Daily Pivot Point R3 | 95.31 |
[/s2If]
Download Nehcap EAWe have two EAs that are operational on our LIVE accounts.
- EA-FIX: Check out the details here. Download EA-FIX . EA-FIX is a non-grid HFT scalper.
- EA-GROWTH: High quality low dd EA using trend grids. Download EA_GROWTHJoin Our Telegram Group
")


