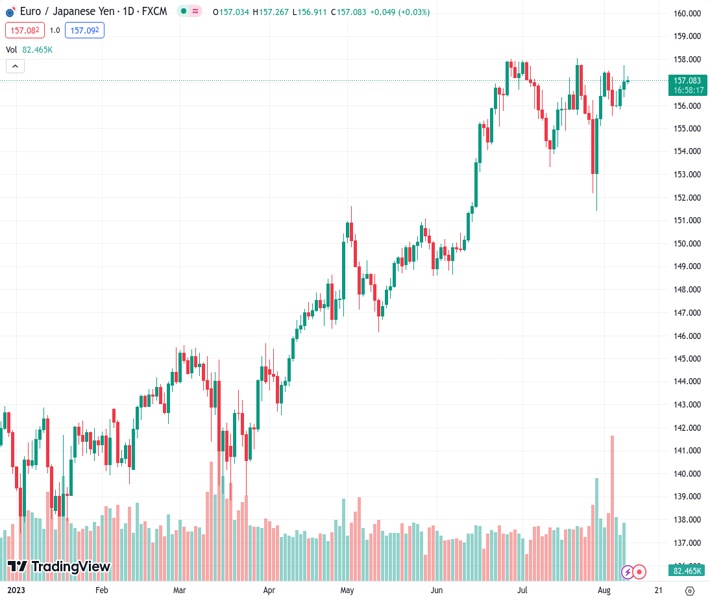
During the Asian session on Wednesday, the EURJPY currency pair moved within a small range of price fluctuations around 157.082.
…
This is a premium post.
[s2If !current_user_can(access_s2member_level4)]Please register for FREE REGISTER to read full post below containing analysis. In case of any error or you think you are not able to read the full post below, please email us at support#nehcap.com [lwa][/s2If] [s2If current_user_can(access_s2member_level1)]
- EUR/JPY oscillates in a narrow trading band through the Asian session on Wednesday.
The pair currently trades last at 157.082.
The previous day high was 157.74 while the previous day low was 156.34. The daily 38.2% Fib levels comes at 157.21, expected to provide resistance. Similarly, the daily 61.8% fib level is at 156.88, expected to provide support.
The EUR/JPY cross struggles to gain any meaningful traction on Wednesday and seesaws between tepid gains/minor losses, around the 157.00 mark through the Asian session. Spot prices, however, remain well within the striking distance of over a two-week peak, near the 157.75 region touched on Tuesday.
A generally softer tone around the equity markets drives some haven flows towards the Japanese Yen (JPY) and turns out to be a key factor acting as a headwind for the EUR/JPY cross. That said, a modest US Dollar (USD) downtick lends some support to the shared currency and helps limit the downside, at least for the time being. The fundamental backdrop, meanwhile, seems tilted slightly in favour of bullish traders and supports prospects for some meaningful near-term appreciating move.
A more dovish stance adopted by the Bank of Japan (BoJ) might continue to undermine the JPY and adds credence to the positive outlook for the EUR/JPY cross. In fact, the BoJ’s Summary of Opinions released on Monday revealed that policymakers backed the case for the need to patiently continue with the current monetary easing towards achieving the price stability target. Adding to this, data released on Tuesday showed that real wages in Japan fell for a 15th straight month in June.
It is worth recalling that the BoJ has emphasised that sustainable pay hikes is a prerequisite to consider exiting easy policies and dismantling its massive monetary stimulus. This marks a big divergence in comparison to other major central banks, including the European Central Bank (ECB), and suggests that the path of least resistance for the EUR/JPY cross is to the upside. That said, speculations that the ECB might halt its streak of nine consecutive rate hikes in September seem to cap gains.
This makes it prudent to wait for some follow-through buying beyond the overnight swing high before positioning for the resumption of the recent sharp rally from a multi-week low touched in July. The EUR/JPY cross might then make a fresh attempt to conquer the 158.00 mark, or its highest level since September 2008, and prolong its well-established bullish trend.
Technical Levels: Supports and Resistances
EURJPY currently trading at 157.11 at the time of writing. Pair opened at 157.09 and is trading with a change of 0.01 % .
| Overview | Overview.1 | |
|---|---|---|
| 0 | Today last price | 157.11 |
| 1 | Today Daily Change | 0.02 |
| 2 | Today Daily Change % | 0.01 |
| 3 | Today daily open | 157.09 |
The pair remains strongly bullish on the daily timeframe. It trades above its 20 SMA @ 155.99, 50 SMA 154.78, 100 SMA @ 150.87 and 200 SMA @ 146.82.
| Trends | Trends.1 | |
|---|---|---|
| 0 | Daily SMA20 | 155.99 |
| 1 | Daily SMA50 | 154.78 |
| 2 | Daily SMA100 | 150.87 |
| 3 | Daily SMA200 | 146.82 |
The previous day high was 157.74 while the previous day low was 156.34. The daily 38.2% Fib levels comes at 157.21, expected to provide resistance. Similarly, the daily 61.8% fib level is at 156.88, expected to provide support.
Note the levels of interest below:
- Pivot support is noted at 156.37, 155.66, 154.97
- Pivot resistance is noted at 157.77, 158.46, 159.17
| Levels | Levels.1 |
|---|---|
| Previous Daily High | 157.74 |
| Previous Daily Low | 156.34 |
| Previous Weekly High | 157.50 |
| Previous Weekly Low | 155.11 |
| Previous Monthly High | 158.05 |
| Previous Monthly Low | 151.41 |
| Daily Fibonacci 38.2% | 157.21 |
| Daily Fibonacci 61.8% | 156.88 |
| Daily Pivot Point S1 | 156.37 |
| Daily Pivot Point S2 | 155.66 |
| Daily Pivot Point S3 | 154.97 |
| Daily Pivot Point R1 | 157.77 |
| Daily Pivot Point R2 | 158.46 |
| Daily Pivot Point R3 | 159.17 |
[/s2If]
Download Nehcap EAWe have two EAs that are operational on our LIVE accounts.
- EA-FIX: Check out the details here. Download EA-FIX . EA-FIX is a non-grid HFT scalper.
- EA-GROWTH: High quality low dd EA using trend grids. Download EA_GROWTHJoin Our Telegram Group
")


