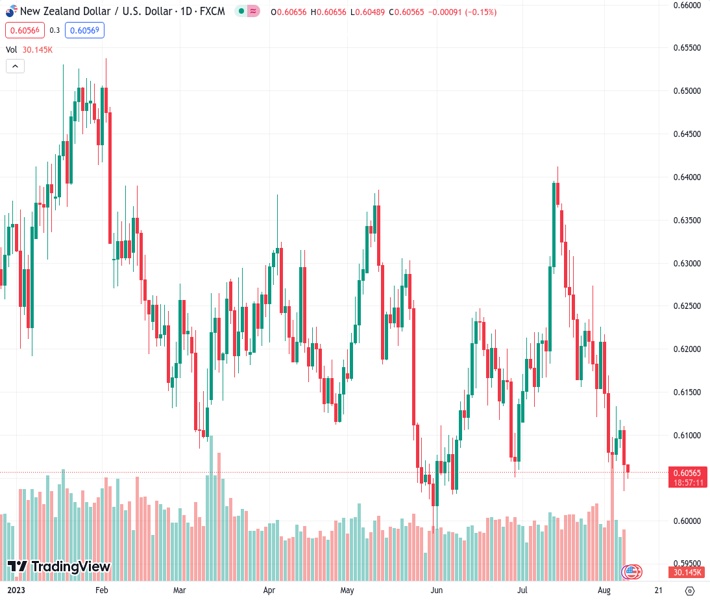
During the Asian session on Wednesday, the currency pair NZDUSD fluctuated within a small range of trading around the level of 0.60547.
…
This is a premium post.
[s2If !current_user_can(access_s2member_level4)]Please register for FREE REGISTER to read full post below containing analysis. In case of any error or you think you are not able to read the full post below, please email us at support#nehcap.com [lwa][/s2If] [s2If current_user_can(access_s2member_level1)]
- NZD/USD oscillates in a narrow trading band through the Asian session on Wednesday.
The pair currently trades last at 0.60547.
The previous day high was 0.6112 while the previous day low was 0.6035. The daily 38.2% Fib levels comes at 0.6064, expected to provide resistance. Similarly, the daily 61.8% fib level is at 0.6082, expected to provide resistance.
The NZD/USD pair struggles to capitalize on the overnight late rebound from the 0.6035 area, or a two-month trough and edges lower during the Asian session on Wednesday. Spot prices remain on the defensive, around the 0.6055-0.6060 region and move little in reaction to the Chinese inflation figures.
In fact, data published by China’s National Bureau of Statistics (NBS) showed that the annual Consumer Price Index (CPI) fell 0.3% in July as compared to a flat reading in the previous month and consensus estimates for a 0.4% decline. On a monthly basis, the headline Chinese CPI rose by 0.2% in July against the 0.1% drop anticipated. This, however, was offset by the weaker-than-expected Producer Price Index (PPI), which contracted by 4.4% YoY in July, and do little to ease fears about faltering recovery in the world’s second-largest economy or provide any impetus to the NZD/USD pair.
That said, hopes for additional stimulus measures from China help limit the pessimism and lends some support to antipodean currencies, including the New Zealand Dollar (NZD). Apart from this, a mildly softer tone surrounding the US Dollar (USD) turns out to be another factor acting as a tailwind for the NZD/USD pair. Any meaningful USD downfall, however, seems elusive in the wake of firming expectations that the Federal Reserve (Fed) will stick to its hawkish stance. In fact, market participants seem convinced that the Fed will keep interest rates higher for longer.
The bets were lifted by the closely-watched US monthly employment details released on Friday, which pointed to the continued tightness in the labour market. Moreover, Fed Governor Michele Bowman on Monday kept the door for one more 25 bps lift-off in September or November and said that additional interest rate hikes will likely be needed to lower inflation to the central bank’s 2% target. That said, Philadelphia Fed President Patrick Harker said on Tuesday that they will probably start lowering the policy rate sometime next year, which, in turn, holds back the USD bulls from placing fresh bets.
Market participants also seem reluctant and might prefer to wait on the sidelines ahead of the latest US consumer inflation figures, due for release on Thursday. Nevertheless, the aforementioned fundamental backdrop seems tilted in favour of the USD bulls and suggests that the path of least resistance for the NZD/USD pair is to the downside.
Technical Levels: Supports and Resistances
NZDUSD currently trading at 0.6059 at the time of writing. Pair opened at 0.6066 and is trading with a change of -0.12 % .
| Overview | Overview.1 | |
|---|---|---|
| 0 | Today last price | 0.6059 |
| 1 | Today Daily Change | -0.0007 |
| 2 | Today Daily Change % | -0.1200 |
| 3 | Today daily open | 0.6066 |
The pair remains strongly bearish on the daily time frame. It trades below the 20 SMA @ 0.6203, 50 SMA 0.6166, 100 SMA @ 0.619 and 200 SMA @ 0.623.
| Trends | Trends.1 | |
|---|---|---|
| 0 | Daily SMA20 | 0.6203 |
| 1 | Daily SMA50 | 0.6166 |
| 2 | Daily SMA100 | 0.6190 |
| 3 | Daily SMA200 | 0.6230 |
The previous day high was 0.6112 while the previous day low was 0.6035. The daily 38.2% Fib levels comes at 0.6064, expected to provide resistance. Similarly, the daily 61.8% fib level is at 0.6082, expected to provide resistance.
Note the levels of interest below:
- Pivot support is noted at 0.6029, 0.5993, 0.5952
- Pivot resistance is noted at 0.6107, 0.6148, 0.6184
| Levels | Levels.1 |
|---|---|
| Previous Daily High | 0.6112 |
| Previous Daily Low | 0.6035 |
| Previous Weekly High | 0.6226 |
| Previous Weekly Low | 0.6060 |
| Previous Monthly High | 0.6413 |
| Previous Monthly Low | 0.6120 |
| Daily Fibonacci 38.2% | 0.6064 |
| Daily Fibonacci 61.8% | 0.6082 |
| Daily Pivot Point S1 | 0.6029 |
| Daily Pivot Point S2 | 0.5993 |
| Daily Pivot Point S3 | 0.5952 |
| Daily Pivot Point R1 | 0.6107 |
| Daily Pivot Point R2 | 0.6148 |
| Daily Pivot Point R3 | 0.6184 |
[/s2If]
Download Nehcap EAWe have two EAs that are operational on our LIVE accounts.
- EA-FIX: Check out the details here. Download EA-FIX . EA-FIX is a non-grid HFT scalper.
- EA-GROWTH: High quality low dd EA using trend grids. Download EA_GROWTHJoin Our Telegram Group
")


