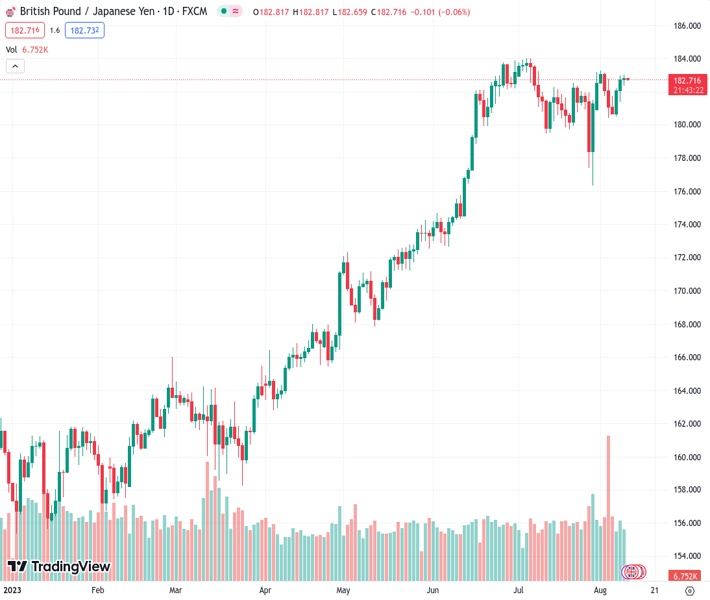
Despite briefly reaching 183.01, the GBPJPY remains below the significant resistance level of 183.00.
…
This is a premium post.
[s2If !current_user_can(access_s2member_level4)]Please register for FREE REGISTER to read full post below containing analysis. In case of any error or you think you are not able to read the full post below, please email us at support#nehcap.com [lwa][/s2If] [s2If current_user_can(access_s2member_level1)]
- Despite a brief touch at 183.01, the GBP/JPY remains anchored below the 183.00 psychological resistance.
The pair currently trades last at 182.718.
The previous day high was 182.96 while the previous day low was 181.39. The daily 38.2% Fib levels comes at 182.36, expected to provide support. Similarly, the daily 61.8% fib level is at 181.99, expected to provide support.
GBP/JPY consolidates around the weekly highs of 182.70s and prints a small candlestick, suggesting the uptrend is losing steam, despite reaching a fresh weekly high of 183.01. However, as the Asian session began, the GBP/JPY exchanged hands at 182.69, well below 183.00, after the Tenkan-Sen crossed above the Kijun-Sen level.
From a technical perspective, the GBP/JPY remains neutral to upward bias but must reclaim the last week’s high of 183.24 to threaten the year-to-date (YTD) high of 184.01. Even though the bullish cross of the Tenkan-Sen above the Kijun-Sen portrays the GBP/JPY as bullish, further confirmation is expected.
Otherwise, if GBP/JPY dives below the August 9 low of 182.36, it would exacerbate a pullback towards the top of the Ichimoku Cloud (Kumo). The GBP/JPY’s first support would be the Tenkan-Sen at 181.82, followed by a support trendline drawn from the lows of April, at 180.80/95, before slumping towards the Kijun-Sen at 180.15, inside the Kumo.
Technical Levels: Supports and Resistances
GBPJPY currently trading at 182.71 at the time of writing. Pair opened at 182.78 and is trading with a change of -0.04 % .
| Overview | Overview.1 | |
|---|---|---|
| 0 | Today last price | 182.71 |
| 1 | Today Daily Change | -0.07 |
| 2 | Today Daily Change % | -0.04 |
| 3 | Today daily open | 182.78 |
The pair remains strongly bullish on the daily timeframe. It trades above its 20 SMA @ 181.4, 50 SMA 180.28, 100 SMA @ 174.0 and 200 SMA @ 168.36.
| Trends | Trends.1 | |
|---|---|---|
| 0 | Daily SMA20 | 181.40 |
| 1 | Daily SMA50 | 180.28 |
| 2 | Daily SMA100 | 174.00 |
| 3 | Daily SMA200 | 168.36 |
The previous day high was 182.96 while the previous day low was 181.39. The daily 38.2% Fib levels comes at 182.36, expected to provide support. Similarly, the daily 61.8% fib level is at 181.99, expected to provide support.
Note the levels of interest below:
- Pivot support is noted at 181.79, 180.81, 180.22
- Pivot resistance is noted at 183.37, 183.95, 184.94
| Levels | Levels.1 |
|---|---|
| Previous Daily High | 182.96 |
| Previous Daily Low | 181.39 |
| Previous Weekly High | 183.25 |
| Previous Weekly Low | 180.46 |
| Previous Monthly High | 184.02 |
| Previous Monthly Low | 176.32 |
| Daily Fibonacci 38.2% | 182.36 |
| Daily Fibonacci 61.8% | 181.99 |
| Daily Pivot Point S1 | 181.79 |
| Daily Pivot Point S2 | 180.81 |
| Daily Pivot Point S3 | 180.22 |
| Daily Pivot Point R1 | 183.37 |
| Daily Pivot Point R2 | 183.95 |
| Daily Pivot Point R3 | 184.94 |
[/s2If]
Download Nehcap EAWe have two EAs that are operational on our LIVE accounts.
- EA-FIX: Check out the details here. Download EA-FIX . EA-FIX is a non-grid HFT scalper.
- EA-GROWTH: High quality low dd EA using trend grids. Download EA_GROWTHJoin Our Telegram Group
")


